Evidence for a likely sample switch in the RNA-seq dataset (or not)

I've been working on the toxin/antitoxin manuscript, trying to extract all the conclusions from the RNA-seq data trove.  We have two odd results, and I now think they are both best explained by a sample switch in the first set of samples.

One odd result that the former post-doc drew my attention to is that, when the antitoxin is deleted, expression of the competence genes appears to be down at the last time point ('M3', 100 minutes incubation in MIV competence-induction medium).

The other odd result, which I just discovered a couple of days ago, is that, when the toxin gene is deleted, expression of the competence genes appears to be up at the second time point ('M1'; 10 minutes in MIV).

Each of these results is based on the mean of three biological replicates (samples pf the same strains cultured on different days).  I now think that they're reciprocal consequences of the same problem - switched identities of one pair of samples prepared on the same day.

History: I was originally focusing on the apparent up-regulation in the toxin deletion, which I discovered in comparisons of the toxin ('toxx') and toxin+antitoxin ('taxx') knockouts.  I was looking at this comparison because it's the only one where we would expect to see any expression differences that might be caused by action of the antitoxin on genes other than the toxin, and I wanted to know if we could rule these out.

The former summer undergrad had done pairwise comparisons of all the different mutants we'd tested, using both the Edge and DESeq2 packages, so I looked at the Excel files he'd generated comparing the toxx and taxx samples, sorting the expression ratios for each timepoint.  I was quite surprised to see that, with the Edge dataset, the genes with the most extreme expression differences at the M1 timepoint were ALL the competence genes (see below).  But there was no overexpression at the M2 timepoint, contrary to what I would expect if this was a competence-related effect, and inconsistent effects at M0 and M3.


So I was worried that this might be due to a problem with only one of the three replicate samples that had been averaged, so I looked at the before-averaging data.  Initially I suspected that two of the taxx samples (M2_E and M3_E) had been switched.  That might still be true, but it was a small effect compared to the bigger toxx anomaly I found when I plotted bar graphs of competence gene coverage for all the taxx and toxx samples.  The graph below is for expression of the comABCDEF operon in the taxx mutant (∆toxT),  but I found the same anomaly for the other operons:  the M1_A sample has much higher expression levels than we normally see at this time (usually only slightly higher than the M0 timepoint).


Now I was suspicious that this 'A' sample might be misidentified - not at M1 timepoint at all.  So I looked at all the samples that had been prepared on this day (Day 'A').  These samples were prepared by the  former research associate; they were the first RNA prep she did for what turned into the big RNA-seq dataset.  Here's the plot of all her Day A samples.


Consistent with my sample-switch hypothesis, the overly high competence-gene expression levels in the toxx M1 sample is balanced by overly low competence gene expression in the antx (∆toxA) M3 sample!  Again I'm only showing the comABCDEF operon, but pilABCD and comNOPQ show the same pattern.  

So my new hypothesis is that the antx_M3 sample and toxx_M1 sample were switched.  This is a good discovery, because it probably explains both the apparent reduction of competence gene expression at M3 in the antx samples and the apparent increase in competence-gene expression at M1 in the toxx samples.  But it's a big hassle, because if I'm right we'll need to redo all the bioinformatics analyses that involve these samples.  Luckily the summer undergrad is still in the picture, and the R scripts left us with should make this task easy.

But I want to be as confident as possible that my switch hypothesis is correct.  The best prediction is that we should see overexpression of toxT and absence of toxA in sample toxx_M1, and the reverse in sample antx_M3.  

(...Pause while I create this graph...)

But we don't!  


One confounding issue is that the expression scoring detects coverage of the remaining ends of the genes, because they weren't completely deleted.  (I can get the former summer student to look at the actual toxT and toxA coverage for each sample to confirm whether the deletions are present.)  

With this taken into account, I think we see the expression we would expect if the samples were not switched.  For the antx samples, we see elevated expression of toxT and toxA at all time points, and for the toxx samples we see normal (like KW20) expression of toxA and reduced expression of toxT. Importantly, the antx_M3 sample has much higher expression of toxT than the toxx_M1 sample.  So I think my hypothesis must be wrong!

OK, now I've checked the expression of toxA and toxT in the samples from other days, and they're nicely consistent with the expression in the Day A samples.  So I guess the samples are not switched.  DAMN!

So why are the competence gene levels so high in the toxx_M1 sample?  I suppose the research associate could just have been delayed in collecting this sample, so it has expression levels closer to those usually seen at 30 minutes.  (Unfortunately her notebook for this period has been lost.)

Maybe it will all seem clearer tomorrow...


Expression of DNA uptake genes in rich medium - a puzzle

I've been working on the toxin/antitoxin paper.  Right now I'm going through the RNA-seq data for the antitoxin knockout (again!), looking for hints of how unopposed toxin expression prevents DNA uptake.  The two graphs below show mRNA levels of the mutant compared to wildtype cells at the same stage of competence induction (upper panel, 30 min in MIV; lower panel, 100 min in MIV). The green bars are expression in the mutant (unopposed toxin) and the grey bars show the range of expression in wildtype cells. (In the upper panel the grey bars are centered on the mean expression at this time point.)

Conclusion:  Expression of competence genes is normal or near-normal at 30 min (when competence-gene transcription normally peaks), but is substantially lower than wildtype at 100 min (when DNA uptake and transformation peak).

Can this reduction explain the absolute competence defect of the mutant?  I think not.


Some other informative comparisons:  

1.  Compare the antitoxin knockout (∆toxA) to the toxin knockout (∆toxT) and the toxin/antitoxin double knockout (∆toxTA):  At 30 min, competence genes in all three knockout mutant have very similar transcription levels (more similar to each other than to KW20).  But ∆toxT and ∆toxTA have normal competence.  At 100 min some ∆toxA operons are a bit lower than in ∆toxTA (comABCDE is at about 65% and pilABCD is at about 50%).

2  Compare the antitoxin knockout to a hfq knockout:  The hfq knockout (∆hfq) is the only mutant we tested whose competence is reduced but not eliminated; it's MIV-induced transformation frequency is about 10% of the wildtype level.  At 30 min it's competence-gene expression levels are mostly higher than those of ∆toxA, which has no detectable transformation (∆toxA TF is 3-4 orders of magnitude lower than ∆hfq).  At 100 min its expression is overall a bit lower than ∆toxA.

3. Compare the antitoxin knockout to wildtype cells in 'late log': Here's where it gets weird.  We've known for a long time that competence rises when cell growth slows as cultures get dense (peaking around OD = 1-2).  Our old microarray experiments showed that expression of competence genes increases then too; in the paper we said that expression levels increased about 4-20 fold, but we didn't present any data. So I decided to compare wildtype expression levels in late log with ∆toxA expression levels at 100 min of induction.  

But I was surprised to see that, in our RNA-seq data, competence-gene expression levels in rich medium don't increase as the culture gets dense.  In the graph below, each cluster of blue bars is a DNA-uptake gene, with three replicate bars at OD=0.02 (true log phase, light blue), OD=0.6 (end of log phase, medium blue) and OD=1.0 (dark blue).  In most cased the dark blue bars are not noticeably higher than the other bars, indicating that the gene is not induced at all when cell density increases.


My first response was to try to find the original microarray data, to see how big an induction we actually saw.  It's probably buried somewhere in my computer (not with the array manuscript files), but I can't find it.  So instead I looked in my notebooks for any problems with the wildtype samples used for the RNA-seq analysis, and here I think I found the explanation.  Along with each sample we prepared for the RNA analysis, we froze one tube of cells that could be checked later for competence or other issues (e.g. contamination).   In May 2015 we had noticed the unexpectedly low expression levels of these samples, so we thawed out OD=1.0 samples and transformed them.  They were about 100-fold less competent than they should have been, which is consistent with their low gene expression.  This comparison is still useful, because even with this nearly undetectable induction the cells did become at least 10-fold more competent that the ∆toxA cells do after MIV induction.


Biofilm assay results

The summer undergrad did the biofilm assay this week. The results are quite clear: Haemophilus influenzae does form what might be biofilms on glass tubes, but this is completely independent of competence gene expression or the ability to make Type 4 pili (T4P).  Thus we won't be able to use biofilm assays to clarify how the toxT toxin prevents DNA uptake.

The basic assay was as described in the previous post.  She tested four strains:  the wildtype parent, which expresses T4P genes and becomes moderately competent at the onset of stationary phase, a strain unable to induce its competence genes (including the T4P genes), a strain whose type 4 pilin gene is deleted, and a hypercompetent strain that expresses all the competence genes very strongly at all stages of growth.

Cultures were grown for one and two days in 2 ml of rich medium in new glass tubes, either stationary in a rack or being gently mixed on a roller wheel.  Here's a photo of two of the Day 2 culture tubes, inverted to dry after staining.  Most of the stationary-culture tubes had a film of cells, mainly at the bottom of the tube (exception explained below).  All of the rolling-culture tubes had a bright film at the air-medium interface.


And here are the results.  (Each bar is the mean of three replicate cultures.)  With the exception of the stationary culture of the 'no pilin' strain, which failed to grow, all cultures gave equivalent staining intensity.  There was no effect of expression of competence genes or deletion of the pilin gene.


Now I need to go back and look at the H. influenzae T4P literature, to see if this is a new result or an entirely predictable outcome.

Later:  I looked through the H. influenzae pilus/biofilm literature.  Other types of pili are needed for biofilm formation.  A knockout of the T4P pilin induced in competent cells causes biofilms (grown in a flow-through chamber and observed microscopically) to be thinner and less 'organized', and reduces biofilm formation in the inner ears of chinchillas, so we might have expected our mutants to show altered biofilm staining.  

Maybe it is worth having the summer student repeat her experiment, so we can describe this in the toxin/antitoxin paper.  What improvements should we include?  
  1. Including no-cells control tubes
  2. Measuring the OD600 of each culture?  But would this require that the tubes be vortexed to resuspend the cells?  Maybe just do it for the 'rolling' cultures (removing 100 µl to 900 µl blank), which won't need to be vortexed.
  3. Anything else?


Does H. influenzae need DNA uptake genes to form lab biofilms?

This morning I had another Skype conversation with the (most recent) former post-doc.  We mostly talked about the toxin/antitoxin work.  One question that came up was whether the antitoxin knockout strain was unable to form simple biofilms as well as to take up DNA.

The kind of biofilm I mean is a simple film of cells that might stick to the surface of the glass or plastic container the cells are being cultured in.  Formation of such films depends on the species (do its cells have a sticky surface), on the genotype (how much of the sticky substances are being produced), on the container properties (glass? polystyrene? polypropylene) and on the culture conditions (cells may stick more easily if the culture is not being shaken).

Here's a diagram of the basic assay; the the amount of crystal violet depends on how many cells were stuck to the tube surface.


Many components of the cell surface can contribute to its stickiness, but we're interested in the effects of type 4 pilin (T4P) structures on the cell surface, because these are used both for adherence to surfaces and for DNA uptake. If our wildtype H. influenzae cells consistently form biofilms, and if this depends on the expression of the normal DNA uptake machinery, then we can test whether the DNA-uptake defect of our antitoxin knockout mutant is accompanied by a defect in forming biofilms.

Why do we care about this?  We know that this mutant has near-normal expression of the genes needed for DNA uptake, so why can't it take up DNA?  If the controls show that biofilm formation requires the uptake machinery, and the mutant does not form normal biofilms, we'll conclude that the toxin interferes with assembly of the basic T4P machinery.  If the mutant does form biofilms, we'll conclude that the toxin specifically blocks the DNA-uptake activity of the T4P machinery that has been assembled and is able to stick to surfaces, perhaps by blocking the retraction step that pulls the DNA in.

The experiments are quite straightforward.  Versions of this assay have been done on various H. influenzae clinical isolates, but not to examine the roles of the type 4 pilus machinery.  We'd use one of our competence-negative regulatory mutants, probably a sxy knockout.  The lab down the hall does similar assays with Campylobacter - I'll ask their advice before proceeding.


One more bicyclomycin try!

The previous Bioscreen experiment failed because, as we suspected, the vial we purchased didn't contain the expected mg of bicyclomycin.  The highest concentration we tested (20 µg/ml) caused only a very slight slowing of growth, so we contacted the supplier and had them send us a new vial.  This contained more visible powder than the previous one had, although still a very tiny amount), and we used it for a new Bioscreen experiment, testing concentrations up to 10 µg/ml.

This time the 10 µg/ml culture showed a substantial slowing of growth.  We also saw smaller decreases in growth, proportionally, with the lower concentrations.  Although the effects were smaller than we expected from the reported MIC (minimum inhibitory concentration of 3 µg/ml, we think we can go on to do our experiment.


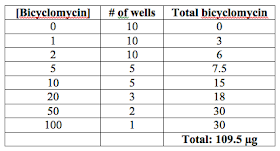
Before we do the big competence-induction experiment we should really do another Bioscreen run to test the higher bicyclomycin concentrations we would need to include in the big experiment.  We can't afford to use up much bicyclomycin to do this, so we'll decrease the numbers of replicate wells we use:

The summer student thinks she can do this tomorrow (she'll fill the other wells with plain medium (no cells) as her contamination control), and then we'll be able to do the big experiment on Friday!