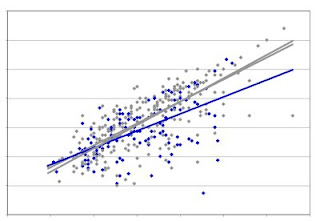
 How do I tell if the blue slope is significantly different from either of the grey slopes? I know just enough about statistics to know that there will be a way to test this, but not enough to do it. And the post-doc I've relied on for statistics help just moved on to a second post-doc position on the other side of the country. What to do?
Google the problem, of course. I think I searched with 'calculate confidence interval for slope, and that led me to this page, one of a collection of Excel Tips for scientists and engineers posted by one Bernard Liengme, a retired professor of chemistry and lecturer in information systems at St. Francis Xavier University in Nova Scotia.
At first the page looked quite daunting. The post-doc confirmed by email that this was instructions for doing what I wanted, but didn't offer to do it for me. I then tried clicking on the link to the sample workbook, which gave me an actual Excel file with the example calculation all set up. So I just did to my data what the example did to its, and presto, I have the confidence intervals for my lines! it's a bit embarrasing to admit that I don't know what the "INDEX(LINEST" command does, but then I don't know what's in the secret buffers and columns of the kits we use either.
So thank you Dr. Liengme! Note - a new edition of his book A Guide to Microsoft Excel 2007 for Scientists and Engineers is available in paperback from Amazon.
p.s. The 95% confidence interval for the blue line overlaps slightly the intervals for the grey lines.


With an interest in Open Science, I was adding your blog to my RSS feeds and noticed your excel post here. I'm more of a LabVIEW guy myself, but since I teach a Junior Lab (Physics) course, I've learned a bit about Excel, particularly LINEST (the built in linear regression function). So, thought I'd leave a comment in case you have more questions about LINEST and use of INDEX function. :)
ReplyDeletePS: You can find our course help page for linear fitting here: http://openwetware.org/wiki/Physics307L:Help/Fitting_a_line
Whoo-hoo! Thanks for the tip! I'm just like you with respect to the statistical competence and for a smallish question like this, you've indicated a great resource (and process for getting there, of course).
ReplyDeleteHey Rosie,
ReplyDeleteFor what its worth, I posted how to use linest on the M&I twiki (not accessible outside UBC) http://twiki.microbiology.ubc.ca/twiki/bin/view/Labs/Eltis/CalcLinestExcel
"Excel will calculate full statistics for linear regression including slope (m(sub)n - usually n=1), intercept (b), errors of these estimates, coefficient of determination (R^2), degrees of freedom, F stat etc. Doing linear regression using a chart will only show slope, intercept and R^2.
In a spreadsheet, type formula =linest([y's],[x's],,true). You need true (or 1) to show all the stats. Hit {enter} (you also need the correct number of comma's). Then, select the cell where you typed the formula, 5 cells down and 2 or more across. Click up on the formula in the formula bar. Hit {F2}, then hit {control}-{shift}-{enter}. This will calculate the formula as an array formula and not just a single cell formula.
Go to Excel help for linest for full details of statistics available. "
Linest is an array formula, meaning you don't just get one piece of info from this formula, you get all the associated stats as well. Following the info above you will see all then numbers calculated. Search for it in excel help (or on the twiki) to see a picture of what the array calculates.
I like showing my array so I can double check things. However, if you know that the SE you are looking for would be in row 2, column 1 of the array, index(linest) will allow you to retrieve just that one piece of data from the array of numbers that are calculated.