


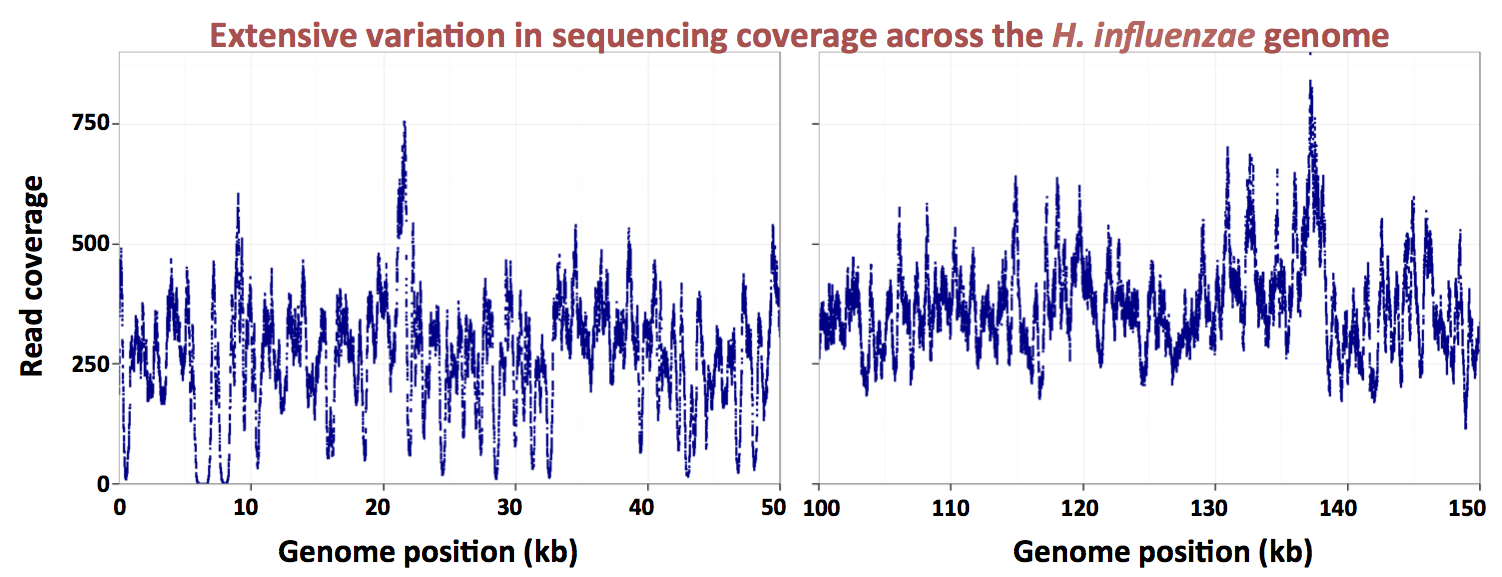
Here's a figure showing how dramatic the variation in coverage is (two 50 kb segments of the genome):
Here's a quick overview of the recombination project. We transformed the Rd strain with DNA from the divergent NP strain, pooled 10,000 novR colonies, and genome-sequenced the pooled DNA at 20,000-fold coverage to measure the frequency of NP alleles at the ~35,000 SNP positions where the two strains differ. This gave a genome-wide map of recombination frequency that showed surprisingly high variation. The graph below shows the reproducibility of this variation across independent samples (one with colonies selected for novR and the other for nalR).

We need to check that some of the apparent differences in recombination frequency at different positions aren't actually due to differences between the sequencing efficiencies of the Rd and NP SNP alleles at these positions. The former post-doc and I had a Skype conversation about this this morning. Here's our plan.
He has the control sequencing data: coverage for each position in the control NP genome sample and in the control Rd sample, each aligned to its own reference genome. To simplify the comparisons he'll first normalize each data set to its mean coverage. If we were to plot the SNP-position coverages against each other we'd expect to see something like this:

For each of the ~35,000 SNPs, the ratio of its NP allele and Rd allele coverages (call it the 'bias ratio') tells us how much sequencing biases could influence its apparent recombination rate.
Now all the former postdoc needs to do is calculate the correlation between the bias ratios and the estimated recombination rates across the genome. If he sees little or no correlation, then sequencing biases are not contributing to the measured frequencies of NP alleles in the recombinant-genome DNA pool and we can continue to search for the factors that do contribute. But if he sees a solid correlation then we need to investigate further.
Steps for the former post-doc:
- Normalize control-genome sequencing coverages to their means.
- Calculate bias ratios for each SNP.
- How much of the recombination variation is explained by the bias ratios?
No comments:
Post a Comment
Markup Key:
- <b>bold</b> = bold
- <i>italic</i> = italic
- <a href="http://www.fieldofscience.com/">FoS</a> = FoS