


I was able to do this because the PhD student just posted two new graphs, showing the uptake peaks in syntenic 20 kb segments of the NP and GG genomes.

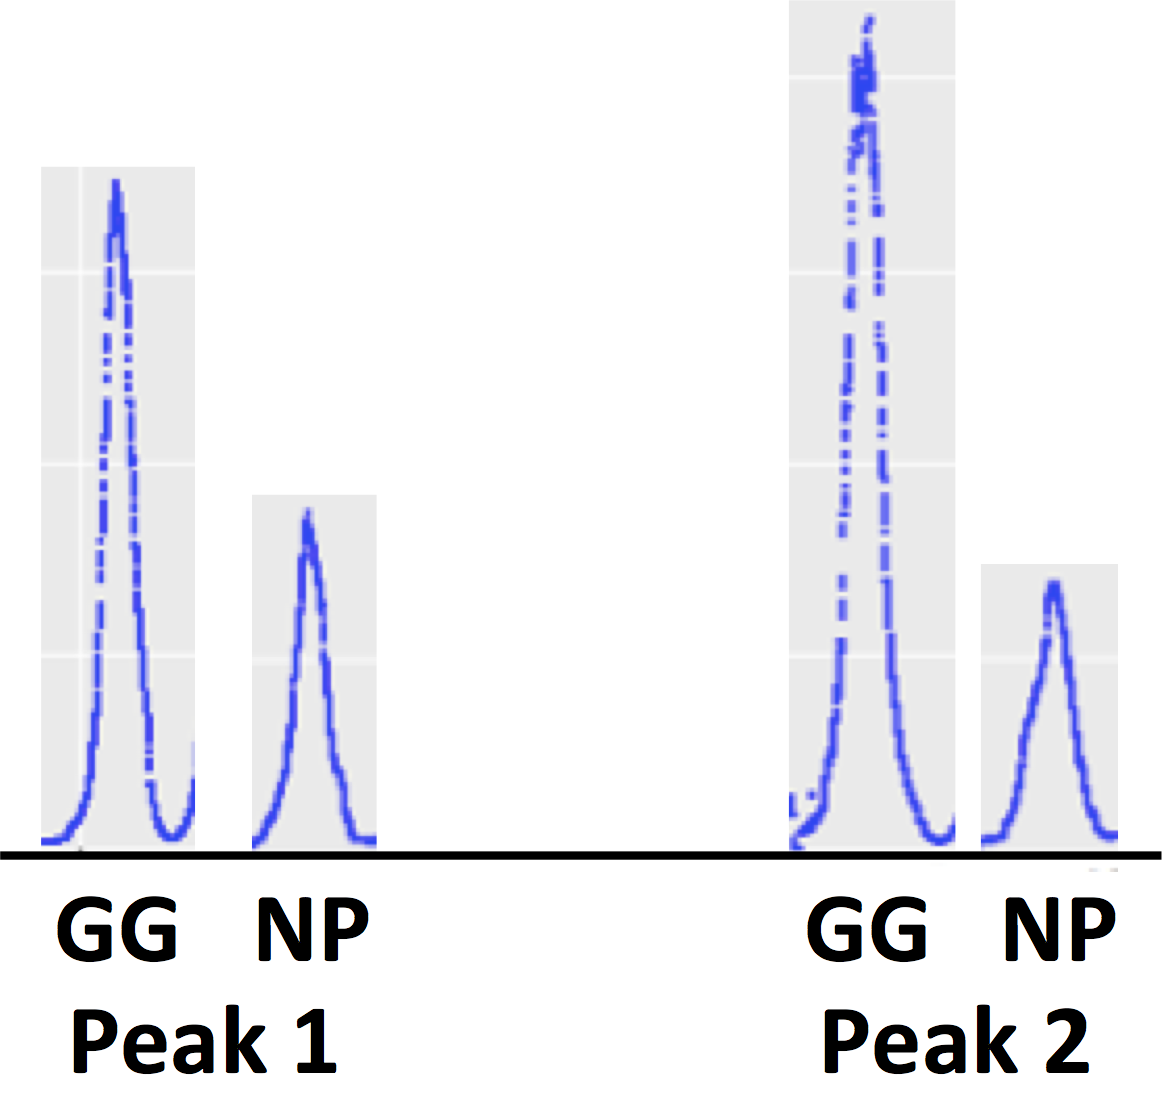
The peaks for the two genomes are in the same places because the underlying DNA sequences are very similar. Most of the peaks also have similar heights in the two genomes, with two obvious exceptions (labelled Discordant peak 1 and Discordant peak 2). Here are those peaks side-by-side, to the same scale:
To look for sequence differences that could explain these uptake differences, I copied the corresponding DNA sequences for these regions from Genbank and examined them for USS. I easily found good matches to the USS motif at (approximately) the centers of both peaks.
Here are the GG and NP sequences for Peak 2, which has the bigger difference in height. I've included a logo showing the USS-uptake motif we determined earlier.

There are lots of differences over this 66 bp segment. None are in the 9 bp USS core, but there are 4 base substitutions and a single-base deletion in the 'unimportant' parts of the motif, and 5 more substitutions nearby. In principle any of these differences could be responsible for the uptake difference.
But here are the corresponding sequences for Discordant peak 1. (It's in the other orientation in the genome.)

This is completely different from Peak 2. There's only one difference between the GG and NP sequences, and it's outside of the USS motif.
Might the sequences outside of the known USS motif be important after all? Here is a comparison between the USSs of Peak 1 and Peak 2. (To get both USSs in the same orientation I took the reverse complements of the Peak 2 sequences.)

So, this analysis didn't find any sequence differences likely to explain the uptake differences. We certainly need to repeat this for other syntenic segments (= most of the genomes). ANd we should examine individual discordant peaks at higher resolution, to see if the peaks in both NP and GG are centered on exactly the same sequences.
What about the possibility that the genomes have methylation differences that cause the uptake differences? That's certainly possible - I wonder if there's an easy (bioinformatics) way to check.
p.s. The PittGG annotation in Genbank is a mess. I spent 2 hours figuring out why the segments appeared to have different genes.
No comments:
Post a Comment
Markup Key:
- <b>bold</b> = bold
- <i>italic</i> = italic
- <a href="http://www.fieldofscience.com/">FoS</a> = FoS