


The Results section of the Sxy manuscript-in-progress has been revised, and I'm waiting for results and figures from the grad students before doing more work on it.
The CRP-S manuscript has been provisionally accepted, with reviews that were both complimentary and useful. Over the next few days the grad student whose work it reports will make the minor corrections it requests and do the new analyses suggested by one especially helpful reviewer, and we'll compose a response for the Editor. Then we'll resubmit and wait for the acceptance email telling us where to send our $1900 payment of the journal's 'Open Access Charge'.
A paragraph (oops, it's turning into an essay) about such publication charges. Until 10-20 years ago, almost all research was published in print journals whose costs of publication were covered by subscription fees and often by advertising revenue. Because only specialists read most journals, the subscription fees were high for individuals (often well over $100 for 12 issues per year) and exorbitant for institutions such as university libraries. Some journals were published by non-profit professional societies, and some by profit-seeking publishers. This arrangement was bad for science, because articles were only available to people whose grants or institutional libraries could pay for a subscription.
Now, much research is published electronically as well as or instead of on paper, and most of it is available free online, either immediately or after a profit-allowing delay (often 6 or 12 months). This is good - research results are much more widely available - but it has reduced the incentive to pay for a subscription, so journal revenues are down. Journals have responded by requiring large financial contributions from the authors of the papers they publish.
This smells like payola, and my knee-jerk reaction to the $1900 charge is outrage, but in fact it's a move in the right direction. The costs of disseminating research should be treated as part of the costs of doing science, and it makes much more sense to pay them as publication charges ($ from research grants) than as subscription fees ($ from university libraries). The 'usual' way (pay for the privilege of reading the papers) was the wrong way. It was the standard only because, before the internet, we didn't have the technology to make our findings widely available. (Readers interested in this issue should check out the Public Library of Science.)
Now, where was I? Oh yes, progress... We're still waiting for the final decision on our revised and resubmitted USS-2006 manuscript, but we don't expect any problems. The Perl project needs attention (the WestGrid server has unexpectedly given our requested runs the cold shoulder), so I'll try to sit down with the post-docs today to sort out where the bugs are and what to do next. I'll also get back into my 'unbiased' search for USS-related motifs in the genome sequence. And maybe I'll get back to the bench for a change - a collaborating grad student needs me to run an assay for him.
Field of Science
-
-
Change of address1 year ago in Variety of Life
-
Change of address1 year ago in Catalogue of Organisms
-
-
Earth Day: Pogo and our responsibility1 year ago in Doc Madhattan
Representing results
One of the grad students and I continue to struggle with finding the best way to represent her results.
The results take the form of gel images - autoradiograms of positions of bands in the gel, representing the sizes of radioactive RNA fragments. But which kinds of bands convey significant information depends on the enzyme that's been used and on the pattern seen in the 'ladder' (unfolded RNA, the control) lane. But the images of the gels are too complex for the reader to make sense of without a lot of effort, and we present a typical one only to reassure the reader that the analysis was competently done. Thus we need to develop a representation that summarizes the gel results.
Sometimes the presence of a band in the 'structure' (folded RNA, the test) lane is significant information, telling us that the folding of the RNA lets the enzyme cut at a place that it couldn't in the unfolded RNA. Other times (different position or different enzyme) the presence of a band tells us nothing. Sometimes the absence of a band tells us that the folding makes that part of the RNA inaccessible, but sometimes it is just because that enzyme can't ever cut at that kind of position. To make matters worse, the gel results, though reasonably reproducible, are not always exactly the same, probably due to slight and unavoidable fluctuations in temperatures and volume measurements.
So we want our representation to convey both positive information and lack of information. One representation needs to say "These bases of the RNA have this cutting pattern with this enzyme, and these other bases have that pattern" and another needs to say "These bases of the RNA have this structure and these other bases have that pattern".
We're still working on it.
The Sxy paper
The grad students and I sat down yesterday to go over the Results section of our rough manuscript about how the cell regulates production of the Sxy protein. Sxy acts with the broad nutritional regulator CRP to induce the other competence genes, so understanding how Sxy is regulated is the most important part of understanding how competence is regulated. We spent most of our time working out the best order for presenting results in, and the best ways to display the results in figures.
The previous version had quite a bit of important data presented numerically in two tables. We've now decided to instead present this data as bar graphs. What matters about this data is not so much the particular transformation-frequency (TF) values we've measured for the different mutants and growth conditions as the relationships between the values (e.g. that cells in late- log growth have much higher TFs than cells in early-log growth, and that the sxy-1-5 mutants have much higher TFs than the wildtype cells). Presenting the data as graphs makes it much easier for the reader to make the important comparisons and see the patterns.
Our first priority now is to get the figures in at least a rough approximation of their final form. We think we have almost all the data we want for this paper. One last experiment - asking if the sxy mutations alter how cells respond to nucleotides (see old posts on Sxy and PurR regulation - sorry I haven't figured out how to link directly to them) - will be completed this week, if all goes well. And one gel (or pair of gels) will probably need to be rerun, to get the best resolution of the bands we want to display.
Yesterday I made "place-marker" versions of the figures we don't have yet, and renumbered all the figures to fit our new plan. Today I'm making the Results-reorganization changes we decided on.
Are we equilibrated yet?
A post-doc and I need to decide the best way to tell when our USS simulations reach equilibrium. This is tricky.
We do expect that each run of the simulation will come to an equilibrium where the processes enriching the genome for USS are balanced by the processes removing USS from the genome. The difficulty comes in deciding how we will recognize that the simulation has reached this state. Because these are 'stochastic' simulations, the numbers of USS undergo a lot of random fluctuation even at equilibrium, and we need to decide when the long-term average has become sufficiently stable to qualify as 'equilibrium'. When the simulation first starts, the number of USSs increases quickly, but as it gets closer to equilibrium the rate of increase gets slower and slower.
How do we decide when to stop? As with many other things, how we decide to do this will depend on how long we're willing to wait, and on how accurate we want our answers to be.
Some versions of the simulations run fast; these are ones we've set to use small 'genomes' (e.g. 10,000bp) and high mutation rates and high uptake probabilities and (probably strong biases. We can easily let these run for many cycles beyond what looks like equilibrium, so that we're sure that the long-term average USS number is stable despite the short-term fluctuations. I think we should do lots of these, so we have a very clear expectation of what to expect.
But the more realistic versions of the simulations will run much slower, as they'll have larger genomes (maybe even as big as the H. influenzae genome, ~1,830,000bp) and lower mutation rates. These will be run remotely on the WestGrid system, and we need to build into them some criteria that tells them when to st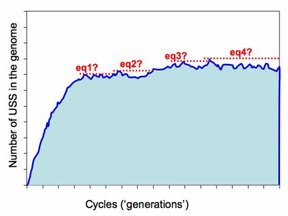 op. The present approach is illustrated in this figure.
The program checks for equilibrium by keeping track of the largest number of USS present in any previous cycle. If a sufficiently long time elapses without this number being exceeded, the run is treated as being at equilibrium and the long-range average number of USS calculated. So the dotted red lines in the figure illustrate four 'local maximum' USS numbers, and the time elapsed before that number was exceeded.
So how long is 'sufficiently long'? Because different settings affect whether it takes 1000 or 1,000,000 cycles to get to equilibrium, 'sufficiently long' is set as a percent of the total number of elapsed cycles. In the past I think I've used 20%, but I don't have any special reason to think this is the best choice. Beginning by doing lots of fast simulations should give us a much better understanding of what matters here.
We do expect that each run of the simulation will come to an equilibrium where the processes enriching the genome for USS are balanced by the processes removing USS from the genome. The difficulty comes in deciding how we will recognize that the simulation has reached this state. Because these are 'stochastic' simulations, the numbers of USS undergo a lot of random fluctuation even at equilibrium, and we need to decide when the long-term average has become sufficiently stable to qualify as 'equilibrium'. When the simulation first starts, the number of USSs increases quickly, but as it gets closer to equilibrium the rate of increase gets slower and slower.
How do we decide when to stop? As with many other things, how we decide to do this will depend on how long we're willing to wait, and on how accurate we want our answers to be.
Some versions of the simulations run fast; these are ones we've set to use small 'genomes' (e.g. 10,000bp) and high mutation rates and high uptake probabilities and (probably strong biases. We can easily let these run for many cycles beyond what looks like equilibrium, so that we're sure that the long-term average USS number is stable despite the short-term fluctuations. I think we should do lots of these, so we have a very clear expectation of what to expect.
But the more realistic versions of the simulations will run much slower, as they'll have larger genomes (maybe even as big as the H. influenzae genome, ~1,830,000bp) and lower mutation rates. These will be run remotely on the WestGrid system, and we need to build into them some criteria that tells them when to st
 op. The present approach is illustrated in this figure.
The program checks for equilibrium by keeping track of the largest number of USS present in any previous cycle. If a sufficiently long time elapses without this number being exceeded, the run is treated as being at equilibrium and the long-range average number of USS calculated. So the dotted red lines in the figure illustrate four 'local maximum' USS numbers, and the time elapsed before that number was exceeded.
So how long is 'sufficiently long'? Because different settings affect whether it takes 1000 or 1,000,000 cycles to get to equilibrium, 'sufficiently long' is set as a percent of the total number of elapsed cycles. In the past I think I've used 20%, but I don't have any special reason to think this is the best choice. Beginning by doing lots of fast simulations should give us a much better understanding of what matters here.
Starting the unbiased look at genome USSs
I'm drafting a manuscript that will compare the sequence preference of the H. influenzae DNA uptake machinery to the consensus sequence of the USS-related repeats in the H. influenzae genome. The previous posts (Reanalysis of old uptake data and New wine in old bottles) were about assembling old uptake-preference data. This post is about work towards an unbiased consensus of the USS-related repeats in the genome.
As I discussed at the end of Representation matters, our present understanding of the USS-like repeats comes from analyses that were intrinsically biased. For example, the analyses presented in our USS-2006 manuscript (see link in sidebar) began with the assumption that the USS would be best defined by a unbroken string of approximately 9 bases. However some of these analyses led to consensus sequences where the flanking AT-rich segments had nearly as strong a consensus as the core we were searching for, leading me to suspect that, if we had instead searched for the flanking consensus, we might have gotten a different but equally valid (or equally invalid) USS consensus. (I'm not happy with this description of the problem, but I'll continue anyway.)
So my goal is to use a motif-search program to search the genome for highly-repeated patterns, starting the searches with as few assumptions as possible, and varying those assumptions to include other possibilities. Several such programs are available on-line; one of the grad students has quite a bit of experience with them. Usually you can just paste the sequences you want analyzed into a web form, click a few boxes, and the analysis appears on the screen (or is sent to your in-box). My kind of bioinformatics.
The grad student advises using the Gibbs Motif Sampler, which is available in simplified form through RSA-Tools and in more sophisticated form through the Wadsworth Institute. The FASTA problem is solved (thanks to helpful readers), so I first tried just giving both versions the first 25000bp of the genome sequence, in five 5000bp sequences, and asking them to find one 9bp motif. The Gibbs analysis is built on Bayesian probabilities, so it asks you to specify a 'prior' expected number of occurrences of the motif. (I'm glad that I now understand a bit about what Bayesian means, if not how to do it - see posts early this month.)
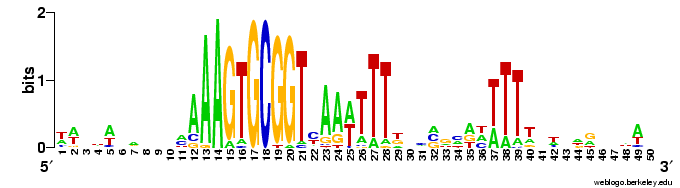
The results come back in various forms; tables of frequencies of each base at each position, and an alignment of the occurrences of the motif it found. The best way to visualize the results is to hand then alignment over to the sequence logo program Weblogo (see Representation matters).

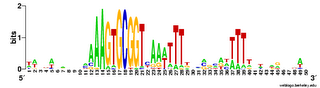
Here are a couple of examples of the logos. The one on the left comes from a search for a 10bp motif, and the one on the right from a search for a 30bp motif.
The first thing I learned (of course) was that this analysis wasn't going to be as simple as I'd hoped.
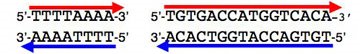
I already know that the long version of the USS consensus is a bit 'palindromic', because Ham Smith pointed this out when he discovered the long version in 1995. ...Brief interruption while I looked for a decent explanation of 'DNA palindrome' on-line, found nothing, and then drew the accompanying illustration. These base-paired DNA sequences are palindromic. In each, the sequence of the upper strand, read from its 5' end to its 3' end (red arrows) is the same as the sequence of the lower strand, read from its 5' end to its 3' end (blue arrows). (The analogy is to a text palindrome like "Madam, I'm Adam".
The USS consensus is far from being a perfect palindrome, but looking at the logo of the long version above shows that there are AAAs at the left end, TTTs at the right end, and a TTTAAA bit in the middle. For the Gibbs motif searches, this is enough that, if the expected number of occurrences is high (i.e. the search stringency is low), it aligns "+"-orientation USSs to "-"-orientation ones.
This only makes sense when we remember that the USS core is not at all palindromic, so on one strand it reads 5'-AAGTGCGGT and on the other strand it reads 5'-TTCACGCCA. About half the USSs in the genome point in one direction (e.g. clockwise around the genome, we can call this "+") and the other half point the other way ("-").
The tendency of Gibbs to align some of them back-to-front can be reduced (maybe even eliminated) by setting the expected number of occurrences quite low (no higher than the number of perfect USS cores we would really expect). This doesn't prevent the Gibbs program from finding more than this number. I need to think more about whether this does prevent it from finding occurrences that match quite imperfectly - my difficulty is that my own brain has a strong tendency to think mainly about the USS core.
I think this is how science is supposed to work - a kind of dialectic between reality and our biases. We start each analysis with expectations that don't match reality, then our biased analysis produces results that, although still wrong, are nevertheless closer to reality than the expectations we started with. We then take these modified expectations into the next analysis, and again get results that are a bit closer to reality. We never perfectly comprehend reality, but with good science we get closer and closer.
As I discussed at the end of Representation matters, our present understanding of the USS-like repeats comes from analyses that were intrinsically biased. For example, the analyses presented in our USS-2006 manuscript (see link in sidebar) began with the assumption that the USS would be best defined by a unbroken string of approximately 9 bases. However some of these analyses led to consensus sequences where the flanking AT-rich segments had nearly as strong a consensus as the core we were searching for, leading me to suspect that, if we had instead searched for the flanking consensus, we might have gotten a different but equally valid (or equally invalid) USS consensus. (I'm not happy with this description of the problem, but I'll continue anyway.)
So my goal is to use a motif-search program to search the genome for highly-repeated patterns, starting the searches with as few assumptions as possible, and varying those assumptions to include other possibilities. Several such programs are available on-line; one of the grad students has quite a bit of experience with them. Usually you can just paste the sequences you want analyzed into a web form, click a few boxes, and the analysis appears on the screen (or is sent to your in-box). My kind of bioinformatics.
The grad student advises using the Gibbs Motif Sampler, which is available in simplified form through RSA-Tools and in more sophisticated form through the Wadsworth Institute. The FASTA problem is solved (thanks to helpful readers), so I first tried just giving both versions the first 25000bp of the genome sequence, in five 5000bp sequences, and asking them to find one 9bp motif. The Gibbs analysis is built on Bayesian probabilities, so it asks you to specify a 'prior' expected number of occurrences of the motif. (I'm glad that I now understand a bit about what Bayesian means, if not how to do it - see posts early this month.)
The results come back in various forms; tables of frequencies of each base at each position, and an alignment of the occurrences of the motif it found. The best way to visualize the results is to hand then alignment over to the sequence logo program Weblogo (see Representation matters).

Here are a couple of examples of the logos. The one on the left comes from a search for a 10bp motif, and the one on the right from a search for a 30bp motif.
The first thing I learned (of course) was that this analysis wasn't going to be as simple as I'd hoped.
I already know that the long version of the USS consensus is a bit 'palindromic', because Ham Smith pointed this out when he discovered the long version in 1995. ...Brief interruption while I looked for a decent explanation of 'DNA palindrome' on-line, found nothing, and then drew the accompanying illustration. These base-paired DNA sequences are palindromic. In each, the sequence of the upper strand, read from its 5' end to its 3' end (red arrows) is the same as the
 sequence of the lower strand, read from its 5' end to its 3' end (blue arrows). (The analogy is to a text palindrome like "Madam, I'm Adam".
The USS consensus is far from being a perfect palindrome, but looking at the logo of the long version above shows that there are AAAs at the left end, TTTs at the right end, and a TTTAAA bit in the middle. For the Gibbs motif searches, this is enough that, if the expected number of occurrences is high (i.e. the search stringency is low), it aligns "+"-orientation USSs to "-"-orientation ones.
This only makes sense when we remember that the USS core is not at all palindromic, so on one strand it reads 5'-AAGTGCGGT and on the other strand it reads 5'-TTCACGCCA. About half the USSs in the genome point in one direction (e.g. clockwise around the genome, we can call this "+") and the other half point the other way ("-").
The tendency of Gibbs to align some of them back-to-front can be reduced (maybe even eliminated) by setting the expected number of occurrences quite low (no higher than the number of perfect USS cores we would really expect). This doesn't prevent the Gibbs program from finding more than this number. I need to think more about whether this does prevent it from finding occurrences that match quite imperfectly - my difficulty is that my own brain has a strong tendency to think mainly about the USS core.
I think this is how science is supposed to work - a kind of dialectic between reality and our biases. We start each analysis with expectations that don't match reality, then our biased analysis produces results that, although still wrong, are nevertheless closer to reality than the expectations we started with. We then take these modified expectations into the next analysis, and again get results that are a bit closer to reality. We never perfectly comprehend reality, but with good science we get closer and closer.
Reanalysis of old uptake data
I've started reanalyzing the old DNA-uptake data (see New bottles for old wine). Yesterday I succeeded in using the Gibbs motif-search software (thank you RSA Tools!) to analyze the sequences from the 1990 paper, and was encouraged when it did find a USS motif in 15 of the 28 sequences. These 15 were fragments that cells had strongly preferred to take up, and the USS motif looks very much like the one derived previously from the whole-genome consensus. This result is very preliminary (I haven't yet kept any notes or done it meticulously), but it suggests that the bias of the uptake machinery does correspond well to the consensus of the genome repeats.
Today I did the preliminary analysis (this time keeping notes) of the phage-derived sequences from one of the earlier papers (1984). These sequences had not been put into GenBank as a neat set, so I had to download the phage sequence and use a nice shareware DNA-analysis program (Sequence Analysis; thank you Will Gilbert!) to identify the sequences of the five short fragments I will analyze.
I still need to deal with an annoying format problem. The motif-search programs accept DNA sequences only in particular formats, of which the simplest is "FASTA". FASTA identifies comment lines by starting them with an ">", but for some reason these programs treat the text after my ">"s as sequence. Of course they choke, because the text contains non-sequence characters (i.e. not just A G C T and N). If I paste FASTA-format sequence in directly from GenBank there's no problem, so I think Word is doing something weird with the ">" character. I need to find a better text editor for Macs (maybe Mi). Unfortunately TextEdit has been 'improved' to the point where it can no longer handle plain text - it insists on saving all files as RTF or HTML.
The ligase puzzle
The old uptake-specificity papers I'm reading (to reanalyze their uptake data, see previous post) include gels showing pools of radioactively-labeled DNA fragments before and after being taken up by cells. In addition to the data I'm looking for, these gels remind me of a puzzle involving a gene for a ligase.
before | uptake
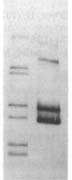 Usually the 'before' pool used in these gels contains end-labeled restriction fragments of a plasmid containing a H. influenzae DNA insert. All the bands are of equal intensity because there are the same number of molecules of each piece of the plasmid. The left lane of the gel figure shows such a 'before' sample. The labeled DNA is then mixed with competent cells, and after a few minutes the DNA that hasn't been taken up is washed away and/or degraded with DNaseI, and DNA is purified from the cells and run in a gel with the 'before' sample. (This 'uptake' DNA prep includes the cells' own DNA, but that's not radioactive so it doesn't show up on the gel.)
There are two kinds of differences between the before and after lanes. First, some of the 'before' bands are missing (or faint) in the 'uptake' lane. That's because these fragments lack USSs and so were taken up poorly or not at all. Second, faint new bands appear that weren't in the Before sample. These are due to the ligase puzzle.
The authors of the paper said that the new bands appeared because of a ligase enzyme that joins the ends of DNA fragments while they are in the periplasm (the space between the outer and inner membranes. Similar bands were seen in similar experiments in later papers from this lab. A ligase in the periplasm has also been invoked to explain the presence of joined-together DNA fragments recombined into chromosomal DNA.
But the whole idea of a periplasmic ligase seemed a bit odd, as what would a ligase do in the periplasm? There isn't normally any DNA there, and even during DNA uptake there's no obvious role for a ligase.
However, when we did a microarray analysis to identify the genes turned on when cells become competent (see link to CRE-2005 paper in sidebar), we found that one of the genes turned on encodes a ligase with a signal sequence that should target it to the periplasm. Unbeknownst to us, the enzyme had already been well-characterized by biochemists - it's a real ligase, but the ATP-dependent kind typical of some phages, rather than the NAD-dependent kind that acts in DNA replication and repair.
So not only were the early researchers correct in invoking a ligase in the periplasm, but this ligase is specifically turned on when cells are preparing to take up DNA. Consistent with such a role, VanWagoner knocked out the ligase gene and found that transformation was reduced about six-fold. However an undergraduate student in our lab spent last year trying unsuccessfully to see evidence of the ligase activity, and she could not replicate this six-fold reduction.
This ligase needs ATP as a source of energy for its ligation reaction. But as far as we can find out, there is no ATP in the periplasm. In fact, the periplasm contains phosphatases that would cut the 'P' off of any ATP that found its way into the periplasm. One solution would be to have the ligase arrive in the periplasm already loaded with ATP. This is consistent with how such enzymes act - they first form a covalent bond with ATP, and then look for DNA to act on. But I don't know if the machinery that transports enzymes into the periplasm could use a ligase that had already assembled with its ATP. Furthermore, such an 'enzyme' could only act once, and it's hard to imagine that taking up DNA is so important that each molecule is worth sacrificing a whole ligase for.
Bottom line: we still have no idea what role this ligase might play in DNA uptake. If the ligase was essential for DNA uptake, explaining what it accomplishes might be seen as a test of any proposed mechanism of DNA uptake. It's easier to think of roles in the cytoplasm, but all the evidence points to action in the periplasm.
New bottles for old wine
I need to decide how to reanalyze some old data.
In a previous post (Representation matters) I mentioned that I had assembled into a Word file some data from old publications by other labs. This file now contains the sequences of all the DNA fragments whose uptake by H. influenzae has been measured, and some indication of how well each fragment was taken up. I want to reanalyze this data to see if I can pull out more information than was available to the original experimenters. I think this might qualify as a 'meta-analysis' because the data comes from several independent studies; I'll say a bit more about meta-analysis at the end of this post.
I've played around with this data in the past, just to see if I could see any new patterns, but now it's time to get serious because I want to be able to include the analysis in a paper correlating the abundance of different USS variants in the genome with the preferences of the uptake machinery. First I should assemble all of the four papers and reread them carefully. One of them has disappeared and isn't available on-line - I may have to walk over to the library tomorrow to get a copy (how old-fashioned!).
The most detailed study (also the most recent - 1990) looked at 28 plasmids with inserts of short H. influenzae DNA fragments. The uptake scores were published, and the insert sequences are in GenBank. All of these plasmids were preferentially taken up over a plasmid with no insert. The uptake scores of 15 of these inserts were also measured after being cut away from the plasmid vector; in most but not all cases uptake of the fragment correlated well with uptake of the plasmid that contained it. And most but not all of the sequenced inserts contained sequences resembling the USS core.
The other papers are older (1980-84). The first reports the work that first identified the USS core sequence. They sequenced four fragments that were preferentially taken up, and found five copies of an 11bp sequence. But there are complications that make this work hard to compare to the 1990 results. First, the DNA fragments did not come from H. influenzae but from the related bacterium H. parainfluenzae. I don't think this should matter. Second, uptake was not quantitated, just scored as yes or no; the band intensities in their gel suggest these fragments are taken up at least 10-fold better than other (no USS) fragments. A later paper (1982) from the same lab examined uptake of two of these fragments more quantitatively, and also looked at fragments with synthetic USSs, using what was then very new technology. The paper gives more gels, and also relative uptake scores for some of the fragments they tested. The final paper also measured relative uptake of purified fragments, this time from the H. influenzae phage HP1.
The 1990 data could be further analyzed by using software to do an unbiased motif-search - does this find the USS pattern? This could be restricted to those fragments that were strongly taken up, or applied to all the fragments. And does how well a particular fragment is taken up correlate with its having a better or worse match to this USS motif?
I would like to be able to then add the results of the earlier work into this analysis, but it's complicated by not having comparable measures of uptake. I think I will have to make some inferences, based on info that is common to the different papers, such as the uptake of the 'negative' fragments. But these inferences will probably not be as solidly justified as I would like.
I think this kind of problem is common to meta-analysis generally. Meta-analysis takes results from different studies that are individually weak or flawed in different ways, and tries to infer a stronger conclusion than could be obtained from any one of the studies. But because the studies are different, approximations always have to be made so the variables analyzed can be made comparable.
Yet another USS representation
I'm working on one more way to represent a USS consensus: positioning it on a DNA double helix.
 This sketch shows the relationships between the USS positions on a real double helix. Unfortunately it doesn't indicate the relative strengths of the different positions' consensus (as the logo does). And I haven't yet taken the time (or found an easy way) to show which positions are at the back and which are at the front as they wrap around the helix. If you look closely you'll see that the pink and blue strands of the double helix are drawn to coil around each other, but the some of letters get in the way of seeing which strand is in front.
When it's drawn properly it will show that the first part of the USS core (the AAGTG) is on the same side of the double helix as the two AT-rich flanking segments. The significance of this will (I hope) be clear once we understand how the USS functions in DNA uptake.
Representation matters
This is the post about how we represent our information about USS sequences.
There are really two issues: (1) what information do we have about how the sequences of DNA fragments affect which fragments competent H. influenzae cells take up?; and (2) how should we represent that information?. (Hmm, some confusion about punctuation here...)
(1) What information do we have about uptake specificity?
As I wrote yesterday, the information comes mainly from two kinds of analysis, uptake bias and genome abundance. Each kind of analysis produces a set of sequences whose similarities can be examined and represented in various ways.
Uptake bias experiments directly measure how many molecules of different DNA fragments are taken up by competent cells, and compares the sequences of these fragments. The papers describing these experiments appeared at least 15 years ago, and the experiments had various weaknesses. One of our postdocs is presently doing a more detailed analysis under more controlled conditions (see my Importance of USS positions post, and the USS-R-US blog). The original experiments used natural fragments of the H. influenzae genome; these were followed by experiments using fragments containing synthetic USS cores and using fragments from the genome of the H. influenzae phage HPi.
These experiments are fussy and time-consuming, so only a small number of fragments have ever been analyzed; I've assembled the results into a single Word file for comparison. They are sufficient to establish that fragments containing the 9bp sequence AAGTGCGGT (or sequences very similar to this) are taken up much more efficiently than fragments with very different sequences. The results also suggest that fragments with AT-rich sequences flanking this 'core' USS are taken up better than those with GC-rich flanking sequences.
This information was represented simply by the core consensus AAGTGCGGT, and most subsequent analyses have focused on this repeat. However this simple representation fails to capture the complexity of even what was known 20 years ago, and the focus on it has not been very helpful.
Things changed as soon as the H. influenzae genome sequence became available. Now it was possible to do the second kind of analysis, examining the abundances of different USS-related repeats in the genome (see Smith et al. 1995 Science 269:538). These repeats are thought to probably reflect the biases of the DNA uptake machinery - we are testing this assumption.

The above representation is taken from Smith et al. They searched the genome for every copy of AAGTGCGGT (in either orientation), and aligned the 1465 sequences this gave. The figure summarizes this alignment by showing the frequency of each of the four bases at each of 50 positions centered on the USS core. It gives no information about the core itself, but shows that some of the sequences to the right of the core have clear AT-rich consensuses (indicated by 'r' or 'w').
To get some information about the core iteslf, Smith et al repeated this analysis using 50bp segments contianing imperfect ("one-off") USSs. This analysis showed that some positions in the core have a stronger consensus than others. But the genome contains only about half as many one-off USSs as perfect USSs (~, and these are divided among 27 different ways to vary, so the effective sample size was quite a bit smaller than for the perfect USSs.
Since then we have done our own analyses on various genomes (see links to the USS-2006 and USS-2004 papers).
Our first alternative representation was a bar chart summarizing the strength of the consensus at each position. This was used for a NIH grant proposal, and later published in a paper with Wang that's not in the link list yet.

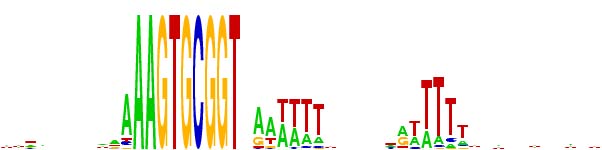
But lately we've been using a different representation scheme - "sequence logos". The multicoloured logo shown below is based on the same information as the table from the Smith et al. paper. Each stack of letters (or absence of stack) represents one of the 50 positions, and the height of each stack indicates how strongly the proportions of the bases differs from that expected of a random sequence. The size of each letter in the stack indicates its frequency at that position. By giving a visual representation of the proportions of each base at each position, it displays the alternatives at each position and the strength of the consensus much more directly than the Smith et al. table.

One remaining weakness is that the sequences used to generate the logo (or the Smith et al. tables) require starting with a specific sequence or set of sequences (e.g. perfect USS or set of one-off USSs). This means that the result will inevitably overrepresent whatever was searched for, and may underrepresent the strength of consensus at flanking sequences.
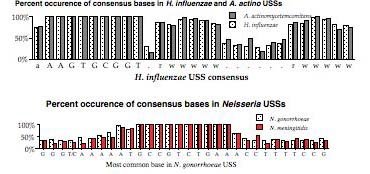
In the USS-2006 paper we made a small attempt to compensate for this, by also searching the A. pleuropneumoniae genome for some of the flanking consensuses. But what we really need to do is an 'unbiased' search of the whole genome for overrepresented sequence motifs. A grad student is familiar with programs that do this; he's been using them to search for the CRP-S promoter motifs in various genomes. But I don't know how easy it would be to modify them to search a genome.
Another remaining weakness is that the various consensus analyses tell us nothing about any tendency for the variation at any one position to be correlated with (??) the variation at any other position. For example, one comment to yesterday's post explained that the sequence TATA is much more flexible than other tetramers. But the consensus representations encourage us to think only of strings of AATTTTs and ATTTTT, and not to consider how many USS might have TATA in their flanking sequences.
There are really two issues: (1) what information do we have about how the sequences of DNA fragments affect which fragments competent H. influenzae cells take up?; and (2) how should we represent that information?. (Hmm, some confusion about punctuation here...)
(1) What information do we have about uptake specificity?
As I wrote yesterday, the information comes mainly from two kinds of analysis, uptake bias and genome abundance. Each kind of analysis produces a set of sequences whose similarities can be examined and represented in various ways.
Uptake bias experiments directly measure how many molecules of different DNA fragments are taken up by competent cells, and compares the sequences of these fragments. The papers describing these experiments appeared at least 15 years ago, and the experiments had various weaknesses. One of our postdocs is presently doing a more detailed analysis under more controlled conditions (see my Importance of USS positions post, and the USS-R-US blog). The original experiments used natural fragments of the H. influenzae genome; these were followed by experiments using fragments containing synthetic USS cores and using fragments from the genome of the H. influenzae phage HPi.
These experiments are fussy and time-consuming, so only a small number of fragments have ever been analyzed; I've assembled the results into a single Word file for comparison. They are sufficient to establish that fragments containing the 9bp sequence AAGTGCGGT (or sequences very similar to this) are taken up much more efficiently than fragments with very different sequences. The results also suggest that fragments with AT-rich sequences flanking this 'core' USS are taken up better than those with GC-rich flanking sequences.
This information was represented simply by the core consensus AAGTGCGGT, and most subsequent analyses have focused on this repeat. However this simple representation fails to capture the complexity of even what was known 20 years ago, and the focus on it has not been very helpful.
Things changed as soon as the H. influenzae genome sequence became available. Now it was possible to do the second kind of analysis, examining the abundances of different USS-related repeats in the genome (see Smith et al. 1995 Science 269:538). These repeats are thought to probably reflect the biases of the DNA uptake machinery - we are testing this assumption.
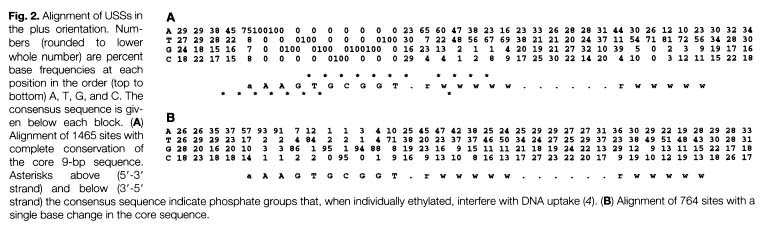
The above representation is taken from Smith et al. They searched the genome for every copy of AAGTGCGGT (in either orientation), and aligned the 1465 sequences this gave. The figure summarizes this alignment by showing the frequency of each of the four bases at each of 50 positions centered on the USS core. It gives no information about the core itself, but shows that some of the sequences to the right of the core have clear AT-rich consensuses (indicated by 'r' or 'w').
To get some information about the core iteslf, Smith et al repeated this analysis using 50bp segments contianing imperfect ("one-off") USSs. This analysis showed that some positions in the core have a stronger consensus than others. But the genome contains only about half as many one-off USSs as perfect USSs (~, and these are divided among 27 different ways to vary, so the effective sample size was quite a bit smaller than for the perfect USSs.
Since then we have done our own analyses on various genomes (see links to the USS-2006 and USS-2004 papers).
Our first alternative representation was a bar chart summarizing the strength of the consensus at each position. This was used for a NIH grant proposal, and later published in a paper with Wang that's not in the link list yet.
But lately we've been using a different representation scheme - "sequence logos". The multicoloured logo shown below is based on the same information as the table from the Smith et al. paper. Each stack of letters (or absence of stack) represents one of the 50 positions, and the height of each stack indicates how strongly the proportions of the bases differs from that expected of a random sequence. The size of each letter in the stack indicates its frequency at that position. By giving a visual representation of the proportions of each base at each position, it displays the alternatives at each position and the strength of the consensus much more directly than the Smith et al. table.
One remaining weakness is that the sequences used to generate the logo (or the Smith et al. tables) require starting with a specific sequence or set of sequences (e.g. perfect USS or set of one-off USSs). This means that the result will inevitably overrepresent whatever was searched for, and may underrepresent the strength of consensus at flanking sequences.
In the USS-2006 paper we made a small attempt to compensate for this, by also searching the A. pleuropneumoniae genome for some of the flanking consensuses. But what we really need to do is an 'unbiased' search of the whole genome for overrepresented sequence motifs. A grad student is familiar with programs that do this; he's been using them to search for the CRP-S promoter motifs in various genomes. But I don't know how easy it would be to modify them to search a genome.
Another remaining weakness is that the various consensus analyses tell us nothing about any tendency for the variation at any one position to be correlated with (??) the variation at any other position. For example, one comment to yesterday's post explained that the sequence TATA is much more flexible than other tetramers. But the consensus representations encourage us to think only of strings of AATTTTs and ATTTTT, and not to consider how many USS might have TATA in their flanking sequences.
USS biochemistry

This post will be about how biochemical modifications of DNA can tell us how different positions of the DNA sequence affect uptake by H. influenzae cells.
I'm planning a separate post about how we represent USS consensus sequences, and about how much information we have about the consensus, but for now I'll just present the extended 'consensus' as AAGTGCGGTnnRRWWWWnnnnnnRWWWWW, where 'n' means any base, 'R' means purine (A or G), and 'W' means weak (A or T). But above I've succeeded in including a 'sequence logo' representation of the genome consensus.
This consensus is mainly based on two kinds of information. The first is sequences that are consistently present in DNA fragments that H. influenzae preferentially takes up. The second is the consensus of repeats in the H. influenzae genome sequence. The consensus is supported by "ethylation-interference" experiments that Ham Smith's lab did about 25 years ago (Danner et al. 1980 Gene 11:311). I'm considering doing (persuading someone else to do?) more of these experiments, and a similar type of experiment called "missing nucleotide" analysis.
Both kinds of experiment work the same way. A short DNA fragment containing a USS (or variant) is radioactively labeled with 32P at one end, and then subject to a chemical treatment that modifies some of the bases or the phosphates that connect the bases. Competent H. influenzae cells are then allowed to take up (try to take up) the labeled modified DNA. It's expected that some modifications will interfere with (or sometimes enhance) this uptake, so fragments that by chance have modifications that interfere won't be taken up, and fragments that have modifications that enhance will be taken up more efficiently than the rest.
The cells, along with whatever DNA fragments they've taken up, are then washed, and DNA is prepared from them. This DNA will be a mixture of the non -radioactive cell DNA (which we can ignore) and the radioactive DNA they took up. The DNA is then treated with a second chemical that breaks the strands at the sites of modification, heated to separate the two strands, and then run in a gel and exposed to film.
If none of the modifications affect DNA uptake, we expect to see a band for each position of the sequence, as each position was equally likely to be modified and each modification was equally likely to be taken up. (We control for these assumptions by separately running in the gel DNA that was broken without ever having been exposed to cells.) But if modifications at some positions prevent fragments from being taken up, then the bands corresponding to breakage at those positions will be missing from the gel. If some modifications increase uptake, their bands will be stronger than the control bands. Here's a link to a paper that used both techniques to analyze interactions between RNA polymerase and the lac UV5 promoter.
The analysis called "ethylation interference" uses treatment with the chemical ethylnitrosourea, which puts ethyl groups (CH3CH2-) onto the phosphates that connect the bases. It chooses the phosphates randomly, so every position is equally likely to be modified. But the extent of ethylation should be limited, so that on average each DNA fragment gets modified at only a single random position.
Ham Smith's lab did this, and found that ethylation at most of the phosphates in the core interfered with uptake. A few positions outside the core, and one in the core, enhanced uptake. At that time these results were used mainly to confirm that the putative USS sequence repeat did interact with the cell's uptake machinery. The authors also speculated that they revealed the positions important for binding. (Note added later: In the next post, Representation matters, I show a figure from Smith et al. 1995 summarizing their analysis of USS in the H. influenzae genome. The *** above and below their consensus sequence indicate the positions where ethylation changed uptake.)
But now I think we may be able to use this kind of analysis to find out more about what the DNA does during the uptake process. Specifically, I suspect that some of the modifications may affect uptake by making the USS easier or harder to bend or kink. I really need to find out how ethylation is expected to change DNA bendability in general - is it more or less likely to bind at the position that's ethylated?
The other kind of modification, used by "missing nucleoside analysis", treats the labeled fragments with hydroxyl radicals. The hydroxyls destroy the deoxyribose, removing a single nucleoside (base plus deoxyribose) from one or more more-or-less random positions in the DNA. This creates a one-base gap in the strand and two extra negative charges (from the exposed phosphates I guess). The double-stranded DNA remains intact except at the site of this gap in one strand. After the cells take up the DNA it doesn't need to be broken, just heated to separate the strands before being run in the gel.
Loss of the nucleoside has two effects. First, any protein side chains that normally interact with that nucleoside make no contact with the DNA; this is likely to weaken the DNA-protein interaction. Second, the missing nucleoside and the broken backbone are likely to make the DNA more flexible and more easily denatured at the site of the gap. I think this might make DNA uptake easier. So, applied to USSs, weaker bands might identify where the DNA contacts the USS-recognizing proteins, and stronger bands might identify sites where bending, kinking or strand separation are needed.
CRP-S manuscript submitted!
We decided to send it to Nucleic Acids Research, because this journal has a strong reputation and is read by everyone who works on CRP.
For us, getting a manuscript to the submission stage is the limiting step. We have lots of results that haven't made it across this hurdle.
Here's my first within-blog link: PDF of the CRP-S manuscript. I hope it works.
And I'll also try to put a semi-permanent link to this manuscript in the sidebar. "Semi-permanent" because I hope we'll soon be able to replace it with a link to the published version.
The computer model of USS evolution
Yesterday the postdocs and I spent some time thinking/talking about our computer model project. I have all sorts of assumptions that the postdocs don't, resulting from all the work I did last year on this, so a lot of time is spent discovering these, explaining them (which requires my rethinking them) and then deciding whether they should be kept or discarded for the present work.
I also worked on my draft (outline, really) of the manuscript describing this work, and got in in good enough shape that it could be given to the postdocs. They can use it to get a clearer idea (because in writing) of what I'm thinking, and thus as a framework to see ways our various ideas can be improved.
And I went through the code of some versions of the program from last summer. Programming (for me) is like experimental research in that I mostly have a series of goals, each resulting from rethinking the previous work and results, but do a lot of blundering around. Thus the various versions have different sub-goals and different flaws, some of which I made of and some of which I didn't. And they're in different degrees of completion - some I think I had set aside without finishing making changes...
But luckily I was very conscientious about annotating the code as I wrote it, so every line or group of lines has at least a few words of explanation. On rereading I found the overall structure of the programs (all very similar) to be less complex than I had remembered it. It was easy for me to bracket off the little clusters of commands and label them with what they were accomplishing. The details of how they accomplish it are not so clear, because I've forgotten how many of the commands work, especially the search and replace ones that are the heart of the program.
I think it's a very nice program. Our first big challenge is to get it to run to 'equilibrium'. That is, after enough generations under any specified settings of the mutation rate and DNA uptake probabilities, the simulated DNA sequence should get to a state where its properties are not changing. Because the simulated steps have a component of randomness, there will still be lots of changes from generation to generation, but when averaged over many generations there should be no net change. Our main scientific goal is to characterize the equilibria, and the approach to equilibria, over a wide range of biologically-relevant conditions.
But getting to and recognizing the equilibria is challenging for a couple of reasons. First, because of the randomness, it's not easy to decide on good criteria for recognizing equilibrium. I'll post more on this another time. Second, getting to equilibrium ( or close enough to meet whatever criteria we set) can take a long time, and so we need to modify the model so we can run it on a fast computer 'grid' we have access to.
How DNA functions constrain USS locations
One question about the accumulation of USS sequences in genomes is the extent that they interfere with coding for proteins and other 'real' functions of the DNA. I've calculates that USS constrain 2-3% of the H. influenzae genome, taking into account the two flanking segments and also the strength of the consensus at these places. That was done years ago, and I probably should redo the calculation, especially as I'm not sure I can even find the original notes.
Seven or eight years ago we started working on this in collaboration with a theoretical physicist (turned bioinformatician) in Taiwan. One of his grad students did extensive analysis but has since gone on to other things, and his supervisor says we're free to finish the analysis and publish it without including them. So I've arranged with our current bioinformatics collaborators to redo the analysis, incorporating various improvements made possible by both our improved understanding of the issues and by the availability of more sequences to analyze.
This is a nice change from most of our work, in that we are starting out with a very good idea of what the results will look like. Not the details, but the general shape of things. I took advantage of this to write much of the paper in advance of getting the results the paper will describe. I made fake figures showing what the data will probably look like, and considering different ways we might present it. And then I sent the whole draft paper off to the collaborators, so they could see where their work is going. And I'm sitting back waiting for them to do the heavy lifting of generating the data.
What are the main findings? We already know that in H. influenzae and Neisseria meningitidis the USSs are preferentially found in the non-coding regions (these is only about 10% of the genome). In H. influenzae about 35% of USS are in non-coding, and in N. meningitidis about 60%. We'll check the ratios for other genomes too. We assume (hypothesize?) that this is because USSs constrain the ability of genes to code for the best amino acids.
The big analysis is done on the USSs that ARE in the coding regions, because here we can determine true sequence homology with other bacteria. We can thus use sequence alignments to find out the degree to which USSs avoid the most highly conserved (= most functionally constrained) parts of proteins. The result is that USSs are preferentially found in two kinds of places. The first is parts of proteins that show little evidence of functional constraint - for example the flexible hinges and linkers between domains. The second is parts of proteins where USSs don't change the amino acids; i.e. where the USS specifies the same amino acids that are optimal anyway. We can also analyze these USSs by the kind of proteins (or RNAs) the different genes produce - USSs are preferentially found in the less important proteins. And we can check whether the protein-coding part of the genome has spare places where USSs could be put without changing the amino acid sequence of the protein. H. influenzae has quite a few of these (I forget the numbers).
Hmm, writing this overview is giving me better ideas of how the paper should be organized.
Does PurR repress any competence genes?
Five or six years ago we published a paper reporting that H. influenzae cells won't become competent if they're given lots of purine nucleotides.
The standard method for inducing H. influenzae to take up DNA is to start them growing in a rich medium called 'supplemented brain-heart infusion' (sBHI for short) and then transfer them abruptly to a starvation medium called MIV ("m-four"). The starvation medium lacks almost everything they normally get from the rich medium to grow, including purine and pyrimidine nucleotides, and we think the reason that cells turn on their DNA uptake genes in this medium is because they can use the DNA they take up as a source of nucleotides. If purine nucleotides are added to the starvation medium, the cells don't become competent. In the paper we were able to test expression of two competence genes and show that they didn't get turned on when the nucleotides were provided.
This only happened with purine nucleotides, not pyrimidines, and we speculated that the reason might be that competence genes were regulated by the PurR repressor. This protein is known to control expression of the genes that make purines for the cell; when purine bases are abundant in the cytoplasm they bind to PurR, enabling it to bind sites in the promotes of the purine-synthesis genes, blocking gene expression. If cells take up DNA to get nucleotides it would make sense to regulate uptake according to the amount of purines in the cell. We were encouraged in this idea by finding what looked like PurR binding sequences in the promoters of a couple of competence genes (comA and rec2). (Note that this was before we had any good idea of what Sxy does, and before we had identified the full set of competence genes.)
So a grad student knocked out the PurR gene. If our hypothesis had been right,this would have made the competence genes come on even when cells had plenty of purines. But it didn't. Furthermore the PurR mutant cells grew normally in sBHI, and developed competence on transfer to normal MIV but not on transfer to MIV with added AMP or GMP. The grad student also tested whether the comA and rec2 genes were now not repressed by nucleotides, and showed cleanly that they were.
Since then we've done a bit more analysis of his mutant. The one microarray we did showed maybe some induction of rec2. But I just went back to the grad student's notes and looked more critically at those potential binding sites for PurR in the comA and rec2 promoters - they now look very unconvincing to me. So unless I can think of a good reason to do more on this, I should stop flogging this dead horse.
Implications of USS modeling
This is a continuation of the previous post about perfect and one-off USSs. I ended that post by concluding that the observed abundances of perfect and one-off USSs is predicted by both my simple math model and our complex simulation model.
I didn't clearly realize when I wrote it that this is in fact a strong test of my hypothesis that, to quote from a previous post, "...USSs accumulate in the genome by a kind of 'molecular drive', caused by the biased uptake system and by the occasional recombination with the cell's own DNA. This molecular drive is inevitable provided the cells sometimes take up DNA from other members of their own 'species', and provided this DNA sometimes replaces the corresponding part of the cells own DNA."
The low frequency of one-off USSs is not expected if we consider only the chances of USS-changing mutations and the presumed interaction between USSs and DNA-binding proteins. But the low frequency makes perfect sense if we also hypothesize that USSs accumulate by molecular drive. Said another way, when the molecular drive hypothesis is made explicit by expression as a model, it predicts precisely the otherwise-puzzling low frequency of one-off USSs.
Yesterday I told the post-docs that we should start outlining the paper we plan to write about this modeling work now, rather than waiting until we have the results. I offered to get it started, and did put together an outline, with a few paragraphs of text pasted in from previous stuff. This paper was going to include everything I described in Sunday's post. But now I realize that we would be wiser to split it into two papers, which I'm about to start outlining.
The first one will use compare the observed frequencies and distributions of USSs in real genomes to those predicted by a molecular-drive-based model of USS accumulation. Probably the model's most sophisticated features will be uptake of perfect and one-off USSs, and some degree of functional constraint on accumulation of USS in gene-sized segments. We can compare the model's predictions to observed frequencies of perfect, one-off and two-off USSs, and to observed distributions of USSs among parts of the genome that are more-or-less constrained by coding functions. The real-genome data for this latter comparison will come from a separate project I'm doing with bioinformatics researchers at another institution; I hope that project will be done in time for this modeling paper to use its data.
The conclusion of this work will be that the molecular drive hypothesis explains attributes of USSs that are otherwise unexpected.
The second paper will have a more sophisticated version of the model, and will address more complex questions about USS evolution. We won't worry much about the details until the first paper is well under way, but I'm going to start outlining it now.
Perfect and one-off uptake sequences
When the H. influenzae genome was first sequenced. Ham Smith did a detailed analysis of the frequency, distribution and variation of uptake signal sequences (USS). Here's a link to the abstract. Previously we only had an approximation of the core consensus (AAGTGCGGT and complement) and very rough estimates of copy number.
One striking thing he found was a disparity between the numbers of 'perfect' and imperfect (we call them 'one-off') USSs. Although the genome has 1571 copies of the 'perfect' sequence where only 8 were expected for a random sequence of the bame base compostion, it has only about 750 one-off USSs. This is surprising for two reasons. First, there are 27 different mutational changes that turn the perfect USS into an one-off (3 at each of the 9 USS positions), so we would naively expect to see lots more one-offs than perfects. Second, USS are thought to function by binding to a protein receptor on the cell surface. When the binding sites of other DNA-binding proteins (e.g. repressors of transcription) have been compared, the consensus is usually much weaker, with most real sites being imperfectly matched to the consensus. So for years I've been wondering whether the scarcity of one-offs is telling us something important about USS evolution and function.
At a conference we both attended when the H. influenzae genome sequence was about to be released (it was the first genome to be sequenced so it was a big deal) Ham mentioned that the ratio of perfects to one-offs could be used to infer the relationship between mutation and the sequence bias of the uptake machinery. I went home and formalized this in some math (really not much more than arithmetic), which seemed to show that the observed ratio of perfects to one-offs predicted a specific ratio of mutation rate to uptake bias. But my model was so simplistic that I didn't take it very seriously.
But yesterday the two post-docs and I got together and discussed how we're going to turn last year's computer simulation USS model into a better model and a paper (see Sunday Aug. 6 post). Later I was reading over notes I'd made last summer on the results I had then, and found a paragraph on the frequency of one-offs that agrees with my simple arithmetical model and probably explains why real one-offs are scarce.
In the computer model, accumulation of USSs in the simulated genome depends on two factors. The uptake machinery must be biased in favour of perfect USS over random sequences; in the model this is simulated by occasionally replacing a one-off USS with a perfect USS. But random mutational changes in the genome are also essential. Otherwise the simulation only creates perfect USSs from the few pre-existing one-off USSs in the original random genome sequence. New mutations are needed to create new one-offs from preexisting two-offs, and to create new two-offs, etc.
But random mutations also happen to the perfect USSs that the uptake bias has created, turning them back into one-offs. Depending on how strong the bias is, these can then be re-replaceded with perfect USSs, or undergo further mutational degeneration. If the mutation rate in the computer model is set too high relative to the uptake bias, degeneration will dominate the process, so that one-off USSs are more likely to mutate into two-offs than to be converted into perfects. In these situations, perfect USSs will not accumulate at all; they will remain at the very low frequency expected for a random sequence of that base composition.
On the other hand, if the bias is stronger than the mutation rate, one-off USSs will usually be converted into perfects shortly after they arise.
What this means is that one-off USSs will only accumulate within a narrow range of mutation/bias ratios. If the ratio is lower than the critical range, perfect USSs will accumulate but one-offs will be scarce because they're rapidly converted to perfects. If the ratio is higher than the critical range, perfect USSs won't accumulate at all. I was about to write "and neither will one-offs", but I'm not sure about that. I could imagine a situation where the ratio was not quite low enough to allow perfect USSs to accumulate, but was low enough to cause significant accumulation of one-off USSs. That will be easy to check, once the model is running again.
So this explains why one-off USSs are so scarce in real genomes that have lots of perfect USSs. Nice.
Probability ≠ likelihood
but only in Statistics. (I promise, this is the last Bayesian post, at least for a while.)
I've always thought that 'probability' and 'likelihood' were synonyms, but yesterday I learned that in Statistics they have distinct and complementary meanings. Unfortunately it's hard to define either of them without using the other, so I'll use the word 'chance' and clarify with examples.
Consider that you have some data and that you have a hypothesis about the reality that produced this data. For example, the data could be that plating the same volume of bacteria on a novobiocin-agar plate and a plain-agar plate gave 43 and 321 colonies respectively, and your hypothesis about reality is that 15.0% of the cells in the culture are able to grow in the presence of novobiocin (are NovR).
Likelihood (as defined for statistical work) is the chance that a real culture with 15.0% NovR cells would have given these numbers of cells when that volume was plated. More generally, it's the chance that the reality you've hypothesized (often your 'null hypothesis') could have produced the particular data you got. This is what classic 'frequentist' statistical methods deal with. Phylogenetic methods using 'maximum likelihood' presumably take this approach.
Probability (as defined for statistical work) reasons the other way around. It's the chance that the culture really has 15.0% NovR cells, given that your plating experiment produced 43 NovR colonies out of 321 total colonies. More generally it's the chance that the reality you're considering is true, given the data you have. This is what Bayesian methods deal with. The phylogenetic software 'Mr. Bayes' presumably takes this approach.
For now I'm not going to worry about why this might matter.
An EryR mutant of H. influenzae
How hard could it be?
As part of a collaboration on the effects of very low concentrations of antibiotics on gene expression (topic for a future post), we need a mutant that is highly resistant to the antibiotic erythromycin (EryR). Erythromycin kills bacteria by blocking their ability to make proteins; it's fairly widely used and resistance mutations are common. These mutations have been studied in a number of different bacteria including H. influenzae.
Resistant strains usually have point mutations that change the large subunit of ribosomes (where protein synthesis happens); either in the genes for the ribosomal RNA (rRNA) or in the gene for either of two ribosomal proteins, called L4 and L22.
Erythromycin-resistant H. influenzae have been isolated from patients after treatment with the antibiotic. But 'clinical' strains (from sick people) are genetically very diverse, and we needed the resistance mutation to be in our standard lab strain KW20. So our first step was to try to isolate our own mutant. In principle this is easy - just plate KW20 on agar containing enough erythromycin to kill normal sensitive cells. But we (i.e. the student working on this) never got any EryR mutants.
Then we decided to try to transfer an EryR mutation from a clinical strain into our KW20 strain. We found a paper from a lab that had studied EryR strains, sequencing the rRNA and L4 and L22 genes to identify specific mutations. They found strains whose L4 and L22 mutations made them highly EryR. So we emailed them and they kindly sent us DNA from two strains (one L4 and one L22 mutant). We had them send DNA rather than bacteria because importation of H. influenzae from the US into Canada requires a government permit and we didn't want to bother with the bureaucracy.
Our plan was to use PCR to amplify the DNA containing the mutations and transform this DNA into KW20, selecting for EryR cells by plating on erythromycin agar. The PCR seemed to work fine, but the transformations never produced any EryR colonies. The cells could be transformed with other antibiotic-resistance genes, but because we didn't have any other EryR strains to use as positive controls we couldn't figure out why we got no EryR mutants.
So the student went back to reading papers, and discovered that the same lab that had sent us the DNA had, in an earlier paper, described doing just what we were trying to do - transform the EryR genes into KW20. And unlike us they were successful! So she contacted the lab again and this time we're going to have them send us the resistant strain, not just the DNA. We're waiting for the permit to arrive (note to self: go check the inconvenient fax machines tomorrow).
Models of USS accumulation in genomes
This is a computer-simulation model project I made some progress on last summer. Now I and two post-docs are going to improve and extend it.
The goal is to simulate how uptake signal sequences (USSs, see two previous posts) could accumulate in genomes due to a bias in the competence machinery that brings extracellular DNA into the cell. We will then compare the predictions generated from different sets of assumptions with the actual distribution and variation of USSs in real genomes.
What real genomes can we compare with the model's predictions: The just-accepted USS paper examined USSs in eight related genomes, all from the family Pasteurellaceae. More pasteurellacean genome sequences are becoming available, including several different isolates of A. pleuropneumoniae and of H. influenzae. The bacteria in the family Neisseraceae also have USS in their genomes: N. gonorrhoeae (1 sequence) and N. meningitidis (2 sequences) for sure, and there might be USSs in other neisseriaceal genomes that I don't know about. So far we know of three different types of USS, the two described in the USS paper, and the one shared by the two Neisseria species.
How and/or why do I think USS accumulate: Many people have assumed that USSs evolved in bacterial genomes to serve as species-specific tags. Bacteria that have USS also have DNA-uptake machinery that preferentially takes up DNA fragments containing their USS; this means that they preferentially take up their own DNA over DNAs from unrelated organisms. Because most people have assumed that bacteria take up DNA to get new versions of genes, or to get new genes, they assumed that bacteria evolved USSs so they wouldn't take up probably useless and possibly dangerous foreign DNAs.
I think these people have been misled by their ignorance of how evolution works (topic for another post) and that bacteria are really taking up DNA as food. Stated less teleologically, genes encoding DNA uptake machinery have been successful because bacteria that have them are able to efficiently use DNA from outside the cell as a source of nucleotides, by bringing the DNA into the cell and breaking it down. Sometimes this DNA recombines with the cell's own DNA, but I think that's just a side-effect of the DNA-repair machinery active in all cells. Bacteria that can't take up DNA can still get nucleotides from DNA outside the cell, but they have to do it by secreting nucleases that break down the DNA outside the cell, and then taking up any nucleotides that don't diffuse away. (As I just described it, DNA uptake seems to be much more efficient a way of getting the nucleotides, but really we don't know the details that would determine the relative costs.)
So, if DNA is just used as food, shouldn't any DNA be just as useful (nutritious) as any other? Why bother having USSs in your genome, if there's no need to exclude foreign DNA? In fact, having uptake machinery that prefers fragments with USSs may be costly, as it limits the cell's choices (makes the cells into 'picky eaters').
One simple explanation for USS and USS-preferring uptake is that the uptake specificity arises as a side-effect of the physical interactions between the machinery and the DNA. Most DNA-binding proteins have some degree of sequence preference (just as some handles fit our hands better than others), and a protein that needs to bind DNA tightly and force it across a membrane is likely to have stronger preferences than one that only loosely associates with DNA. A related factor is that the DNA probably must be bent or kinked to pass across the membrane, and some sequences bend and/or kink more easily than others.
This would explain why the DNA uptake machinery is biased. But why are there so many copies (1000-2000) of its preferred sequence in the genome, when there are only a few copies of similar but non-preferred sequences? I think the USSs accumulate in the genome by a kind of 'molecular drive', caused by the biased uptake system and by the occasional recombination with the cell's own DNA. This molecular drive is inevitable provided the cells sometimes take up DNA from other members of their own 'species' (don't worry about how we might define 'species' in bacteria), and provided this DNA sometimes replaces the corresponding part of the cells own DNA.
The computer model is (will be) designed to make this molecular drive explanation explicit, and to compare its predictions with what is seen in real genomes.
Modeling with Perl: I chose to write the model in the computer language Perl. I had never used Perl, but knew that it is the preferred language for bioinformatics work because of how easily it works with sequences. So I bought a book called Beginning Perl for Bioinformatics and starting writing code and debugging code. Eventually I advanced to running simulations and improving code and debugging the 'improved' code and waiting around for simulations to reach the elusive equilibrium... Then it all got pushed aside by more urgent work. And now we're starting up again.
What the current version of the model can simulate: It starts by creating a long DNA sequence; 200,000 bp was a typical size I used (= about 10% of the H. influenzae genome). The base composition is specified by the user (38% G+C for H. influenzae). It then 'evolves' the DNA sequence through many generations of mutation (rate specified by user, usually ≤0.0001 changes per base pair per generation) and a step simulating DNA uptake+recombination. In this step, any USS-length sequence that is only one mismatch away from the H. influenzae USS core (AAGTGCGGT and ACCGCACTT) may be replaced by a perfect match to the USS. The probability that this happens is specified by the user (usually ≤0.1). In a more realistic version of the model, USS-length sequences that are two mismatches away can also be replaced, and both these and singly-mismatched sequences can be replaced by other singly-mismatched sequences.
The consequence of repeating these two steps over many generations is that perfect USSs accumulate in the sequence. The program keeps track of the number and locations of these, and at specified intervals it reports the number of USS in the genome. At the specified end of the run it reports more details, including the evolved sequence of the simulated genome (it reported the starting sequence when it began the run).
Two more complex versions of the program do the following:
1. Find the equilibrium distribution of USSs: For any settings, an equilibrium should be reached when the loss of USSs by mutation is balanced by the creation of USSs by mutation and uptake+recombination, i.e. when the effects of mutation and molecular drive are balanced. We want to know about this equilibrium for two reasons. First, we want to compare both equilibrium and non-equilibrium USS distributions to those of real genomes. Second, getting to true equilibrium takes MANY thousands of generations (sometimes maybe millions), and for most simulations we probably will only need to get 'reasonably close' to equilibrium. However we can't know what 'reasonably close' is until we've characterized the approach to the true equilibrium. The model does this, watching for the number of USSs in the genome to stabilize. But for some important conditions this was taking a very long time (at least several days on a lab computer); this is what I think we'll need WestGrid for (see below).
2. Track what happens when the specificity changes: We know that the USS specificities of the two subclades of Pasteurellaceae have diverged (see USS paper abstract; sorry, I haven't figured out how to do internal links yet). If we can simulate how USS distributions change during such divergences, maybe we can make inferences about how the Pasteurellacean divergence happened. In particular,w e want to know if the new USSs appear in the places of the old USSs or in new places. In the present model, once a preset number of USSs have accumulated, the uptake+recombination step changes its perfect USS sequence from the H. influenzae (Hin-type) USS to the A. pleuropneumoniae (Apl-type) USS. Over many more generations, this change in the molecular drive causes the genome to lose its Hin-type USSs and accumulate Apl-type USSs.
The Hin-type and Apl-type USSs differ at three positions (AAGTGCGGT vs ACAAGCGGT). The switch in specificity can occur in one step, or in three steps, each changing one position, with the new genome accumulating the intermediate USSs before the next specificity change is made. I think there are one-step and three-step versions of the program.
At the end of each step, when the specified number of USSs have accumulated or the specified number of generations been simulated, the positions of these USSs are compared to the positions of the previous type USSs.
What I would like the improved model to simulate:
- Full-length USSs. Not just the 9bp core but the flanking sequences too. This may be tricky because the flanking sequences appear to have a much looser consensus than the core.
- Effect of adjacent USSs on uptake+recombination. In most genomes most USSs are separated by only 1-2kb., and in the lab bacteria readily take up big DNA fragments containing several or many USSs. But we have no idea how these USSs might interact during uptake. Simulating ways that interacting USSs might affect uptake will affect how USSs are distributed along the simulated genome. We will then be able to compare these distributions to those of real genomes and make inferences about the real interactions.
- Effects of USSs on other functions of DNA. The present model treats the DNA as function-less, as if we were only simulating a junk-DNA component of the genome. But most real DNA in bacterial genomes codes for proteins, and this will place varying constraints on where USSs will be tolerated.
Bayesians and frequentists
No, I'm not making this up - people who prefer the (old-fashioned? classic?) non-Bayesian kind of probability analysis really do call themselves 'frequentists'.
Both kinds of analysis deal with the general problem that we can't absolutely know the truth, but must use samples and/or tests to approximate it. Here's what I think the differences are:
The classic approach thinks in terms of samples of the real world, and calculates how closely the samples are likely to reflect reality. If one sample from a bacterial culture, plated on novobiocin agar, gives 28 (NovR) colonies, and a parallel sample (same volume) on plain agar gives 386 colonies, we can calculate the probability that the whole culture has 28/386 NovR cells. We can use replicate samples to estimate the error in, for example, measuring the volumes of culture we used.
The Bayesian approach thinks in terms of the reliability of our information and tests, and calculates how the result of a test changes our previous estimate about reality. For example, based on previous similar experiments we might have estimated the NovR frequency at 15%. But we also know that the plating test isn't perfect, and we can estimate how likely it is to be wrong in different ways. Depending on our expertise, we might take into account the risk that NovS colonies grow on novobiocin agar or fail to grow on plain agar, and how much error our volume measurements have. Bayes' theorem and the associated methods tell us how to revise our original estimate (15% NovR) in the light of the new information (28/386 NovR).
OK, I think this is as far into Bayesian analysis as I want to go. But I'd greatly appreciate comments from readers with more expertise, telling me if what I've written in these three posts is seriously off track.
Preview of coming attractions
Some more topics I should write about (in no particular order):
- The Perl model of USS evolution.
- comE1 knockout phenotype.
- Role of pilB in DNA uptake (lack of pilT)
- How to test whether Sxy kisses CRP.
- Recombineering.
- Back to Bayes-ics.
- Laser tweezers and DNA uptake.
- Sub-inhibitory antibiotic effects.
- The search for an Ery-resistant mutant.
- Testing the H. influenzae genome in E. coli.
- Competence in natural populations.
- How purine nucleotides might affect competence induction.
- Competence and maybe hypercompetence in A. pleuropneumoniae.
- Growth and DNA uptake in mucus.
- How might DNA get across the outer membrane.
- Whether USSs help DNA to bend.
- How mutant MurE might turn on sxy.
- The reason(s?) bacteria take up DNA.
USS paper accepted!
Good news yesterday. Our paper on the evolution of competence and DNA uptake specificity in the bacterial family Pasteurellaceae has been accepted (pending very minor revisions). Here's the abstract:
Background
Many bacteria can take up DNA, but the evolutionary history and function of natural competence and transformation remain obscure. The sporadic distribution of competence suggests it is frequently lost and/or gained, but this has not been examined in an explicitly phylogenetic context. Additional insight may come from the sequence specificity of uptake by species such as Haemophilus influenzae, where a 9bp uptake signal sequence (USS) repeat is both highly overrepresented in the genome and needed for efficient DNA uptake. We used the distribution of competence genes and DNA uptake specificity in H. influenzae’s family, the Pasteurellaceae, to examine the ancestry of competence.
Results
A phylogeny of the Pasteurellaceae based on 12 protein coding genes from species with sequenced genomes shows two strongly supported subclades: the Hin subclade (H. influenzae, Actinobacillus actinomycetemcomitans, Pasteurella multocida, Mannheimia succiniciproducens, and Haemophilus somnus), and the Apl subclade (Actinobacillus pleuropneumoniae, Mannheimia haemolytica, and Haemophilus ducreyi). All species contained homologues of all known H. influenzae competence genes, consistent with an ancestral origin of competence. Competence gene defects were identified in three species (H. somnus, H. ducreyi and M. haemolytica); each appeared to be of recent origin.
The assumption that USS arise by mutation rather than copying was first confirmed using alignments of H. influenzae proteins with distant homologues. Abundant USS-like repeats were found in all eight Pasteurellacean genomes; the repeat consensuses of species in the Hin subclade were identical to that of H. influenzae (AAGTGCGGT), whereas members of the Apl subclade shared the consensus ACAAGCGGT. All species’ USSs had the strong consensus and flanking AT-rich repeats of H. influenzae USSs. DNA uptake and competition experiments demonstrated that the Apl-type repeat is a true USS distinct from the Hin-type USS: A. pleuropneumoniae preferentially takes up DNA fragments containing the Apl-type USS over both H. influenzae and unrelated DNAs, and H. influenzae prefers its own USS over the Apl type.
Conclusions
Competence and DNA uptake specificity are ancestral properties of the Pasteurellaceae, with divergent USSs and uptake specificity distinguishing only the two major subclades. The conservation of most competence genes over the ~350 million year history of the family suggests that lineages that lose competence may be evolutionary dead ends.
We and our coauthors in Ottawa and London are very pleased. We had originally submitted the manuscript to BMC Biology, but the Editor recommended that it instead appear in BMC Evolutionary Biology -- this sister journal is more specialized but has a higher 'impact factor'. I'm going to put links to Abstracts and PDFs of all our recent papers on the sidebar soon.
Mr. Bayes comes to the lab
After skimming a lot more web pages about Bayesian inference (most not very helpful to someone like me), I think I can state the basics. Because I'm realizing that our ability to understand stuff like this depends strongly on the kinds of examples used, and on how they're described, I'll try using an example relevant to our research.
Bayesian inference is a way of reasoning that tells you how new evidence should change your expectations. Think about a yes/no question about reality, such as "Is my culture contaminated?" or "Do USS sites kink during DNA uptake?" In the real world where Bayesian reasoning is helpful, we usually don't approach such questions with a blank slate, but with some prior information about the chance that the answer is yes. (Prior is a technical term in Bayesian reasoning, but don't assume I'm using it correctly here.)
For example, our prior information about the chances of contamination might be that about one in 50 of our past cultures has been contaminated. We don't yet have any real evidence about this culture - we just want to check. Before we do the very simple test of smelling the culture, we know two things about this test. We know that the probability that a contaminated culture smells different is, say 75%. But we also know that our sense of smell can sometimes mislead us, so that 5% of the time we think a uncontaminated culture smells different. So we have three pieces of information, one about the prior probability of contamination (2%) and two about the reliability of the smell test. Bayesian reasoning tells us how to use the information about the test's reliability to change our estimate of contamination probability.
So we sniff the culture and decide it does smell different. What if it didn't smell different? In each case, what would be the revised probability of it being contaminated? Revised is in bold here because Yudkowsky's explanation emphasizes that what we're doing is using our test results to revise our previous estimate.
To proceed we need to combine the two pieces of information we had about the test's reliability with our before-test probability of contamination. One way to think about this is to spell out the different possibilities. This kind of example is easier to understand with integers than with probabilities and percentages, so let's consider 1000 suspect cultures, 20 of which will really be contaminated.
--If our culture is one of the 20 in 1000 that is contaminated:
-----75% of the time (15 cultures) we'll score its smell as different.
-----25% of the time (5 cultures) we'll score its smell as normal (a false-negative result).
--If our culture is one of the 980 in 1000 that is not contaminated:
-----5% of the time (49 cultures) we'll score its smell as different (a false-positive result).
-----95% of the time (921 cultures) we'll score its smell as normal.
So if our suspect culture does smell different, the probability that it really is contaminated rises from 2% to 15/(15+49) = 23%. We used information about the reliability of our test to decide how much we should revise the original estimate. If the culture doesn't smell different, the probability that it is not contaminated would be revised up from 98% to 921/(921+5) = 99.5%.
I'll try to come back to this in another post, after the ideas have had time to settle into my brain.
Trying to understand Bayesian reasoning about probabilities
I'm trying to understand what 'Bayesian' analysis of probability is. It's been explained to me in conversation several times, and I've just read an explanation of it in a book on probability ("Chances Are"), but none of these has resulted in any learning or understanding on my part. Of course this is an excellent illustration of what I'm always saying from my perspective as a teacher - if you don't actively work with the concepts you won't learn them.
Part of the problem is that, although explanations start out in plain English and simple arithmetic, they soon lapse into statistical symbols and equations where everything is prefaced by 'P', causing my reading style to switch into 'skip over this dreary bit' mode.
I do think it's probably important that I gain some understanding of this new Bayesian stuff, because it appears to be very popular among people who know what they're doing with probabilities. So trying to explain it in the blog is a way to force myself to figure it out.
Now I'm reading an on-line 'intuitive' explanation by Eliezer Yudlowsky. He emphasizes intuitive and visual explanations (and how the way that a problem is presented affects our ability to understand it), and so far it makes sense. He also has interactive applets where the reader can change the proportions and probabilities - another way to minimize passive reading.
So far I'm about 40% through his long web page, and I'm not sure I've learned anything yet. Maybe tomorrow.
How sxy expression is regulated
Much of today was spent on a still-very-rough paper about how the regulatory protein Sxy is itself regulated. The regulation of Sxy is critical to understanding how bacteria decide to take up DNA, because the amount of Sxy protein in the cell determines how strongly the DNA uptake genes are themselves turned on. Hey, I just realized that the statement I just made didn't have much direct experimental support until now. The first solid evidence for this statement will be in this paper: we have mutants that increase the amount of Sxy in the cell, and we have measured both how much Sxy protein is present and how much DNA they take up, so we can show that increasing Sxy causes increased uptake of DNA.
This morning, when I and the two grad student authors started working through it, the rough draft we had was pretty bad - the experiments and ideas weren't in a logical order, so the draft didn't tell an interesting story. But after we talked it through we found a much better order for the experiments, and now the importance of the results is clearer to me.
And what is this importance?
1. We show that mutations that cause more Sxy to be made act by disrupting the base pairing in a key part of the mRNA that codes for Sxy. Mutations that weaken base-pairing = more sxy mRNA and Sxy, mutations that strengthen base-pairing = less Sxy.
2. We can be quite sure that this base-paired mRNA helps the cell decide how much Sxy should be made.
3. We show that cells make less sxy mRNA and Sxy protein when they are provided with purine nucleotides. This is important because we think cells take up DNA because they have run short on nucleotides. This result tells us that Sxy is the 'transducer' that connects the nucleotide-sensing component to the genes for taking up DNA. We would very much like to know whether the base-paired part of sxy mRNA is the sensor. To find this out we would need to show that nucleotide sensing is altered in the base-pairing mutants, which we haven't done yet.
4. We show that the base pairing mutations change both the amount of sxy mRNA in the cell and the amount of Sxy protein that's made from each sxy mRNA. The effect on the amount of mRNA could arise because the mutations relieve an obstacle to making the mRNA (they help the elongation step of transcription) or because they make the mRNA molecules more stable (they hinder the degradation step). The effect on the amount of Sxy protein per mRNA must arise because the mutations relieve an obstacle to protein synthesis. Our best hypothesis is that they make it harder for the base pairing to block the ribosome's access to its binding site on the mRNA.
The paper still needs LOTS of work, but I'm much more pleased with it than I was this morning.
Importance of USS positions
The goal of this series of experiments is to find out how important the individual positions within the H. influenzae uptake signal sequence (USS) are for DNA uptake. The experiments were originally done by a technician several years ago, but the data had a lot of variability (big error bars) because the results were not very reproducible from one experiment to the next. So they were never published.
Now a post-doc is repeating them so we can get better (more reproducible and therefore publishable) data. But there are still problems with sensitivity and reproducibility. In this post I want to consider several questions: 1. How can we improve these specific experiments? 2. What steps should we take now towards getting the paper written? 3. Do we have other data that should be included in the paper? 4. Should we do additional new experiments?
Some background:
The USS is a 29bp segment of DNA whose presence in DNA fragments strongly influences whether cells will take them up. It was originally studied by DNA uptake experiments using cloned and/or synthetic DNAs. The sequence is strongly over-represented in H. influenzae DNA and most of our recent inferences have come from comparisons of the many (~1500) copies in the chromosome The bases at 9 positions in the USS are usually considered to be the 'core' (this is what there are ~1500 copies of), possibly only because this specificity is the easiest to recognize. Two other 5-6bp flanking segments on one side also show a strong consensus, but we have little or no direct evidence about their importance in DNA uptake.
The goal of the original series of experiments was to directly test the importance of individual positions within the USS for DNA uptake, to find out whether the base frequencies at each position of the many genomic copies are really good predictors of their importance for DNA uptake.
1. How can we improve these specific experiments?
The experiments use a series of cloned restriction fragments, each differing from the standard USS at a single (or two) positions. The changes replace the most-common base with the least common base for that position. The original experiments used short fragments (~200bp I think) synthesized and 32P-labeled as PCR products. For the new series these short fragments have been cloned in an E. coli vector (total length ~4000bp?) which is linearized and end-labeled using kinase. The labeled fragments are then incubated with competent H. influenzae cells, and the cell-associated 32P is measured after extensive washing of the cells by centrifugation.
The labeling experiments appear to work fine, but the cells never take up as much DNA as we think they should. Hmm, I don't think we have directly calculated how much DNA the cells should be taking up. This is important because the new fragments are about 20x longer than those used previously. Would we get better results with shorter fragments?
2. What steps should we take now towards getting the paper written?
We (the post-doc and I) should start writing it now. I think bits of it (the old Methods, probably not very applicable now as the methods have changed) were written up years ago. Writing now will help us clarify what else we need to do.
3. Do we have other data that should be included in the paper?
Should we include our analysis of Sol Goodgal's old taken-up sequences? I did this analysis 6 or more years ago, and it was going to be included in another paper, by a former post-doc. Oops, or maybe the present uptake data was going to be included in the former post-doc's paper - I need to sort this out NOW.
Any other data we already have?
4. Should we do other new experiments for the paper?
One of the early papers investigating uptake specificity (from Ham Smith's lab) used DNA ethylation (?) to randomly modify positions in an end-labeled fragment containing a USS, and then measured how modifications at different positions interfered with binding (and uptake?) by competent cells, by examining the modifications in the fragments that were (or were not?) taken up. We should check whether this experiment could be improved now that we know more about the USS and (maybe) have more specific questions to address.
Can we find out anything about how such modifications are expected to change the structure of the DNA? Maybe its ability to bend or kink?
In at the deep end
Ideally I would begin this blog with an overview of all our research, explaining our big goals and the various approaches we're taking to them. But a thorough overview would be enough work that I'm likely to put off doing it. So instead I'm just going to jump right into posting about current research projects, and fill in the background as I go.
The CRP-S manuscript:
This manuscript describes a PhD student's work on the specialized CRP-binding sites that control transcription of competence genes in H. influenzae. We keep thinking that it's at the 'nearly finished' stage, but we keep finding ways to substantially improve it. It's now a fine manuscript showing the following:
First, that the genes that are regulated by CRP-S sites in H. influenzae are present in a much wider group of bacteria (the gamma-proteobacteria). This is important because most of these bacteria have not been shown to be competent.
Second, in a subgroup consisting of three major families these genes are all also regulated by CRP-S sites. This is important because nobody know about CRP-S site regulation until we discovered it, even though regulation by CRP has been very intensively studied in E. coli.
Today creating this blog has sidetracked me from using BookEnds to add all the references into this manuscript, while the grad student author works on polishing the figures and finding a few stray bits of information.
Testing...
This is my first post to this new blog.
The purpose of keeping the blog is to give me a semi-public place to describe the ongoing process of doing and thinking about my lab's research. I hope I'll use it to describe/explain (mainly to myself) the scientific issues I'm thinking about:
-what experiments we've done
-what the results were if they worked (or possible explanations for why they didn't work)
-what I think the results mean for the questions we're trying to answer
-what experiments I think we might do or should do when time and resources permit.
The purpose of this post, however, is mainly to see what happens when I click on 'Publish Post'.
Subscribe to:
Posts (Atom)