


I've been wondering how interdependent the different parts of the uptake machinery are.
We have long known that some H. influenzae mutants (knockouts of rec2 or comF) could take up DNA but not translocate it into the cytoplasm. They take up about the same amounts of DNA as do wildtype cells, but the DNA stays intact (double-stranded, not degraded). Because this DNA doesn't get cut by the nucleases we know to be active in the cytoplasm, the DNA must be accumulating in the periplasm. This means that the uptake machinery can continue to operate in the absence of translocation.
What about ComE1? This H. influenzae protein is a homolog of the well-characterized B. subtilis protein ComEA. In B. subtilis, ComEA is thought to sit on the periplasmic side of the membrane, under the thick cell wall (there is no outer membrane). The pseudopilus machinery (specified by the ComG proteins) passes DNA across the cell wall to ComEA, and ComEA passes the DNA to the membrane transport machinery (homologs of Rec2 and ComF).
ComEA is essential for DNA uptake in B. subtilis, and its homologs are essential in other competent bacteria. But the H. influenzae homolog, ComE1,is not essential - knockouts reduce transformation by only about 10-fold, and reduce uptake by only about 7-fold. Nevertheless, let's assume that ComE1 does more or less the same thing that ComEA does - accepts DNA from the pseudopilus and passes the DNA on to the machinery that moves it across the inner membrane.
Here's the question: Can the pseudopilus keep doing its job (reeling DNA in) even if ComE1 isn't passing the DNA on? Put another way, do mutations in comE1 reduce DNA uptake, or are they like mutations in rec2 and comF? I already told you the answer - a comE1 knockout reduces DNA uptake as well as transformation. We've known this for several years, but I only now put it into the context of the newer B. subtilis results.
So this means that my model of DNA uptake has to include ComE1 accepting the DNA from the pseudopilus and passing it on to Rec2 and ComF if they're available, or letting the DNA pile up in the periplasm if they're not. If ComE1 isn't there, the pseudopilus stalls. The residual transformation we see in cells lacking ComE1 probably means that about 10% of the DNA finds its way from the pseudopilus to the translocation machinery even in the absence of ComE1, and that this machinery can transport DNA that hasn't been handled by ComE1.
This interpretation makes a prediction about an experiment we've already done - that the reduced DNA uptake seen in comE1 mutants is still USS-dependent. And that's what we see. There's another prediction, that comE1 mutants should not be defective in the initiation of uptake (passing the initial loop through the pore) but only in the subsequent reeling in of the DNA by the pseudopilus. Perhaps we can test this using laser-tweezers, or by cross-linking analysis. From this perspective the comE1 mutant may be very useful in helping us dissect steps of uptake, as it would cause uptake to stall or slow.
This is all very satisfying. We've had the comE1 data for a long time, and tried to write it up, but haven't published it because it didn't seem to explain anything. I think our confusion arose from trying to distinguish between 'binding' and 'uptake' of DNA, whereas now I'm distinguishing between the 'initiation' and 'continuation' of uptake. Now we have a framework for these results, they will make a nice little paper. Unfortunately the technician and M.Sc. student who did the work are long gone so they can't help rewrite the draft, and some of their experiments should be repeated and expanded a bit. Luckily one of the present post-docs is doing similar experiments on other strains, and it would probably be quite simple for her to do the needed experiments and help finish the paper (on which she would then be first author).
Field of Science
-
-
Change of address1 year ago in Variety of Life
-
Change of address1 year ago in Catalogue of Organisms
-
-
Earth Day: Pogo and our responsibility1 year ago in Doc Madhattan
Sticky tip?
I'm deep into the literature on type four pili. (They're variously abbreviated as Tfp or T4P - I'm going to go with Tfp* because a Google search for Tfp pilin finds over 10,000 hits, whereas a search for T4P pilin finds only 273.)
I was thinking that the USS-specific interaction between pilin subunits and the DNA sequence flanking the core USS would be mediated by the positively charged regions of the pilin that are exposed on the sides of the pilus, but it could instead be a region that is exposed only at the pilus tip.
When Tfp cause adhesion or twitching motility by sticking to surfaces, it's the tip of the pilus that does the sticking. Because of the way the subunits assemble, the top and part of the sides of each non-tip subunit are covered by the subunits above them, but the tops and parts of the sides of the subunits at the tip are exposed, and can interact with their environment.
If the side of the pilus was interacting with the USS outside of the pore, when the pilus retracted the pore would need to accommodate the pilus plus the two sides of the DNA loop. But the pores that have been studied aren't big enough for this; they are about 6-7nm across when open, and can fit a pilus (5-5nm), or two filaments of double-stranded DNA (2nm each), but not them all, and maybe not even the pilus plus one filament of DNA.
Thus continuing uptake may require that the pilus stay in the periplasm, and reel the DNA in through the pore (as I drew it in this post). But when uptake is being initiated the pilus must protrude through the pore to form the initial attachment to the DNA. Pulling the DNA in through the pore would be a lot easier if the DNA was attached to the pilus tip rather than to its side.
I have an initiation figure that shows the DNA binding to the side of the pilus; I'll modify it and add it to this post later.
* Except of course when corresponding with someone who prefers T4P, such as the author of a recent helpful review.
The proposal is finally taking shape
My research proposal finally is reading more like a narrative and less like a disjointed string of ideas.
One experiment that I'll be looking for advice on is to cross-link transforming DNA to the proteins that are taking it up, re-extract the DNA with its attached proteins, undo the cross-links, and identify the proteins.
I also have the name of someone to consult with about the cross-linking. Given the limited number of uptake events we can have, we'll want the cross-linking to be as efficient as possible.
One experiment that I'll be looking for advice on is to cross-link transforming DNA to the proteins that are taking it up, re-extract the DNA with its attached proteins, undo the cross-links, and identify the proteins.
- The DNA will be our USS-1 fragment, about 200bp with a perfect USS in the middle. It will have a biotin molecule on each end.
- The 'taking up' could be done by cells, but we'll get cleaner results if we can start with a preparation of cell membranes, or blebs ('transformasomes') or pili, i.e. material enriched for the uptake machinery but unable to translocate DNA across the inner membrane.
- The cross-linking will probably be done with the chemical formaldehyde, because these cross-links can easily be undone (though I don't know how).
- Re-extraction of the DNA plus any cross-linked proteins will use the biotin tags, by mixing everything with agarose beads covered with the biotin-binding protein streptavidin. We can easily then separate the beads, with their attached DNA with its cross-linked proteins, from everything that isn't cross-linked to the DNA.
- Then the cross-links will be undone and the DNA digested away with DNase I. (Maybe only one of these steps is needed?)
- Then the protein mixture will be examined by a mass spectrometry technique called MALDI-TOF, which separates the proteins by their size. MALDI-TOF gives very precise size measurements, and these may be sufficient to let us identify specific proteins.
- Identifications can be checked by repeating the cross-linking analysis with mutant cells lacking known proteins.
I also have the name of someone to consult with about the cross-linking. Given the limited number of uptake events we can have, we'll want the cross-linking to be as efficient as possible.
Rachael's boyfriend's plasmid, and rifampicin
I ran into a colleague at the coffee pot today, and asked his expert advice about ways to investigate whether RNA polymerase pauses or stalls when transcribing the sxy gene.
He said that pausing is quite easy to show using a commercially-available E. coli in vitro system (as I had hoped it would be), but that showing that a H. influenzae sequence causes pausing in this system would only be significant if we first showed that the H. influenzae sxy gene was regulated in vivo in E. coli as it is in H. influenzae. The alternative is to use a H. influenzae in vitro system, but we would have to purify the components ourselves, which is well beyond both our abilities and our real interests.
We might be able to show the regulation in E. coli, if the sxy gene wasn't so toxic to E. coli (see Making lemonade). Well, we could perhaps work with a truncated gene, subject to the same transcriptional controls but not producing Sxy protein... Hey! In fact, one of the very first sxy plasmids I made would be just the thing! The plasmid is named pDBJ90 (the name I think is the initials and year of the boyfriend of the student who made it); it contains only the 5' half of the sxy coding region but all of the upstream sequences that affect its transcription. And it's in a high-copy vector. And as far as I know the insert is stable, though we've learned that we should always check the sequence. I don't know whether our Sxy antibody will recognize the truncated protein it should produce.
What would the experiment be? Grow the E. coli cells with the plasmid in minimal medium with added purines and pyrimidines. Add cAMP to induce the sxy promoter, and transfer half the culture to the same medium with no purines or pyrimidines. Measure the amounts of sxy mRNA and protein at several time points for each half of the culture. If the ratio of protein to RNA is higher when the purines and pyrimidines are absent, then we can do the in vitro experiment.
The colleague also suggested an entirely new way to look at the relationship between sxy transcription and sxy translation. He reminded me that mutations in the genes for RNA polymerase can make the polymerase resistant to the antibiotic rifampicin, and told me that these mutations can affect the efficiency of transcription in ways that might change sxy expression. So here's the experiment plan:
Starting with wildtype (rifS) H. influenzae cells, select cells that are resistant to rifampicin. I think these are quite easy to select; we could try several different rifampicin concentrations. Pool all the colonies that grow up on rifampicin plates, and select hypercompetent ones by transforming the pooled cells with novR DNA while they are in log-phase growth in sBHI. If we get any hypercompetent cells, check whether the hypercompetence is caused by the rifR mutation, by using their DNA to transform fresh cells to rifR. If yes, we've shown that mutations in RNA polymerase can cause hypercompetence.
We do already have one RNA polymerase mutation that affects competence induction. It's an insertion that doesn't change the sequence of RNA polymerase but probably reduces the amount of polymerase in the cell, and it decreases competence rather than increasing it. I can make up a just-so-story that fits this mutant into our current model, but it's just handwaving.
Two directions at once?
More about DNA uptake:
Provided there’s enough space in the secretin pore, there’s no reason why the continuing-to-pull mechanism can’t act on both sides of the loop. This is especially true if, once the DNA has gotten started, the pilus doesn’t need to protrude through the pore but can just pull from within the periplasm, leaving the channel of the pore unblocked so DNA can move through it. The pore is easily wide enough for two double-stranded DNAs to pass through, and the non-specific binding between pilus and DNA that must be transmitting the pulling force can act on both DNAs at once, if they’re binding to different sides of the pilus.
Provided there’s enough space in the secretin pore, there’s no reason why the continuing-to-pull mechanism can’t act on both sides of the loop. This is especially true if, once the DNA has gotten started, the pilus doesn’t need to protrude through the pore but can just pull from within the periplasm, leaving the channel of the pore unblocked so DNA can move through it. The pore is easily wide enough for two double-stranded DNAs to pass through, and the non-specific binding between pilus and DNA that must be transmitting the pulling force can act on both DNAs at once, if they’re binding to different sides of the pilus.
Grappling with (and by) type IV pili
Transport of DNA across the outer membrane presents two big problems, neither of which have been well articulated to date. The first is the difficulty of getting started, which requires pulling an initial loop of double stranded DNA across the membrane. The second is the difficulty of continuing to pull a long fiber of DNA into the confined space of the periplasm.
Both are probably explained by the ability of the fibers called type IV pili to bind to DNA and to be pulled into the periplasm. Type IV pili are long narrow threads composed of identical protein subunits (pilins) arranged in a rope-like helical coil (abut 6nm wide and up to 5 µm long). They are assembled in the periplasm by adding subunits to the base, and elongated and retracted by addition and removal of subunits. The pili that pull DNA are really 'pseudopili' because they're so short, but for simplicity I'll refer to both long and short ones as pili.
I've posted before about the getting-started problem (see for example Getting the kinks in), so here I'll try to explain the continuing-to-pull problem, whose importance I only realized a few days ago while discussing DNA uptake with one of the post-docs. Let's assume that a loop of DNA has bound to the pilus and been pulled across the outer membrane into the periplasm. And for now let's assume that we need only consider what's happening to the DNA of one side of the loop, and can ignore what might be happening to the other side of the loop.
The big problem is that retraction of the pilus can only pull the DNA in a short ways, no more than the length of the pilus. As the pili that transport DNA are too short to see even with electron microscopy, we think they must be barely long enough to protrude through the secretin pore, probably less than 20nm long. This is only 5 turns of the pilin helix, and only about 20bp of DNA. So how does the pilus pull in DNA molecules that are at least 10 kb long? Here are figures illustrating two solutions.
 The first is compatible with the way long pili cause adhesion and 'twitching motility'. The pilus attaches to DNA, pulls it in a bit by disassembling pilin subunits at the base, pulling the pilus down. It then lets go of the DNA, elongates a bit by adding subunits at the base, and grabs a fresh part of the DNA to pull on. In the figure I've shown the pilus as short enough to not protrude through the secretin pore, leaving the pore free for the DNA. This would limit the length of each pilus 'stroke' to the thickness of the periplasm. Under normal circumstances this would be only about 10nm, but the pilus may push the membranes further apart.

The second model is more elegant, but requires a new mechanism that we have no direct evidence for. The first two steps are the same; the pilus binds DNA and pulls it in by disassembling subunits at the base of the pilus, which pulls the pilus down. But in this model new subunits are continuously added to the other end of the pilus, so it never gets shorter and continuously binds and pulls new DNA down into the periplasm.
The drawings are more-or-less to scale, but the periplasmic space may be thicker than shown, which would allow the pilus to be longer without obstructing the pore.
The first model is more parsimonious, in that it uses the retraction mechanism that we know works for the long pili that mediate adhesion and twitching motility. Initially I thought that the pilus might have difficulty letting go of the DNA before elongating, but when I drew the model I realized that, once the pilus becomes very short it will be unable to bind DNA and so release will be spontaneous.
Can we design experiments that distinguish between these models? And is this something that our big grant proposal should address? I'll leave the answers for another post.
Both are probably explained by the ability of the fibers called type IV pili to bind to DNA and to be pulled into the periplasm. Type IV pili are long narrow threads composed of identical protein subunits (pilins) arranged in a rope-like helical coil (abut 6nm wide and up to 5 µm long). They are assembled in the periplasm by adding subunits to the base, and elongated and retracted by addition and removal of subunits. The pili that pull DNA are really 'pseudopili' because they're so short, but for simplicity I'll refer to both long and short ones as pili.
I've posted before about the getting-started problem (see for example Getting the kinks in), so here I'll try to explain the continuing-to-pull problem, whose importance I only realized a few days ago while discussing DNA uptake with one of the post-docs. Let's assume that a loop of DNA has bound to the pilus and been pulled across the outer membrane into the periplasm. And for now let's assume that we need only consider what's happening to the DNA of one side of the loop, and can ignore what might be happening to the other side of the loop.
The big problem is that retraction of the pilus can only pull the DNA in a short ways, no more than the length of the pilus. As the pili that transport DNA are too short to see even with electron microscopy, we think they must be barely long enough to protrude through the secretin pore, probably less than 20nm long. This is only 5 turns of the pilin helix, and only about 20bp of DNA. So how does the pilus pull in DNA molecules that are at least 10 kb long? Here are figures illustrating two solutions.
 The first is compatible with the way long pili cause adhesion and 'twitching motility'. The pilus attaches to DNA, pulls it in a bit by disassembling pilin subunits at the base, pulling the pilus down. It then lets go of the DNA, elongates a bit by adding subunits at the base, and grabs a fresh part of the DNA to pull on. In the figure I've shown the pilus as short enough to not protrude through the secretin pore, leaving the pore free for the DNA. This would limit the length of each pilus 'stroke' to the thickness of the periplasm. Under normal circumstances this would be only about 10nm, but the pilus may push the membranes further apart.
The second model is more elegant, but requires a new mechanism that we have no direct evidence for. The first two steps are the same; the pilus binds DNA and pulls it in by disassembling subunits at the base of the pilus, which pulls the pilus down. But in this model new subunits are continuously added to the other end of the pilus, so it never gets shorter and continuously binds and pulls new DNA down into the periplasm.
The drawings are more-or-less to scale, but the periplasmic space may be thicker than shown, which would allow the pilus to be longer without obstructing the pore.
The first model is more parsimonious, in that it uses the retraction mechanism that we know works for the long pili that mediate adhesion and twitching motility. Initially I thought that the pilus might have difficulty letting go of the DNA before elongating, but when I drew the model I realized that, once the pilus becomes very short it will be unable to bind DNA and so release will be spontaneous.
Can we design experiments that distinguish between these models? And is this something that our big grant proposal should address? I'll leave the answers for another post.
First questions first
The other day we sat down together to take our first joint look at the grant proposal I'm writing. The proposal is still rather inchoate (first time I've used THAT word), especially the experiments section, but it's coming along.
Our model for how the secondary structure of sxy mRNA regulates its expression proposes that the speed of progress of RNA polymerase along the gene determines whether the secondary structure forms before ribosomes can bind and start translating. So I was proposing to directly test whether RNA polymerase pauses or stalls, especially when nucleotides are limited. But one of the grad students pointed out that we first need to show that the secondary structure does indeed block translation. Now she's given me information about a kit that should let us do just that, using cloned wildtype and mutant sxy sequences she's already made.
The kit uses the E. coli translation machinery to translate mRNAs that it makes from a user-provided DNA template with a T7 polymerase promoter. Her sxy clones have this T7 promoter - she's used it to synthesize the RNAs she's used for the RNase digestion analyses. We can use the sxy-1 and sxy-7 mutant RNAs to see if minor changes to the secondary structure change the ability of the E. coli ribosomes to start translation, and we can create a version that lacks most or all of the secondary structure as a positive control, to show how much translation happens in the absence of secondary structure.
It would be scientifically better to do this analysis with H. influenzae translation machinery (rather than E. coli), but we'd need to develop the system from scratch rather than using a kit, and I don't want us to invest that much work into this question. Once we know what happens with the E. coli kit, we can maybe try it with a H. influenzae cell-free lysate.
Does competence help cells survive replication arrest?
In the previous post I described my hypothesis that the CRP-S regulon unites genes that, in different ways, help cells cope with running out of nucleotides for DNA synthesis (dNTPs). The DNA uptake genes help by getting deoxynucleotides (dNMPs) from an alternative source (DNA outside the cell) and the genes for various cytoplasmic proteins help by stabilizing the replication fork until the dNTP supply is restored.
So we really ought to try to directly test whether becoming competent helps cells survive sudden nucleotide shortage. I think I tried this a long time ago (when I was a post-doc in Ham Smith’s lab). Then I was hoping to show that DNA uptake helped cells survive transfer to MIV. I did establish a clear survival curve for cells in MIV. I also found out that adding DNA didn’t make much difference.
I tested various competence mutants we had then - these were miniTn10kan insertions that reduced competence by knocking out various genes. The only one that I remember made any difference to survival was the one we now know knocks out CRP. This is the one mutation in that set that is definitely regulatory - it prevents induction of all the CRP-S regulon genes, and all the CRP-N regulon genes too.
My hypothesis predicts that crp- cells would not turn on the genes that help them survive this crisis, and so should survive worse. BUT (as I recall) the crp mutant cells survived MIV much better than the wildtype cells! Yikes, this is the opposite of my prediction. I need to go back and reexamine this old data.
Hmmm... The old experiments had compared the number of cfu (cells capable of growing into colonies) after 100 minutes in MIV to those after about 16 hours (overnight) in MIV. I compared 6 mutants to the wildtype strain. Five of them survived better, and one much worse. But the 'much worse' strain isn't really a competence mutant at all - we now know its mutation knocks out a DNA topoisomerase that that non-specifically reduces the induction of many unrelated genes. Four of the mutants survive about 5-10-fold better, and the crp mutant survives about 100-fold better.
One concern is that my hypothesis is about short-term survival, in the emergency situation created by transfer to MIV, and so wouldn't necessarily apply to overnight survival. I haven't explicitly tested short-term survival, but the numbers of cfu at 100 minutes should be a rough indicator if this, as the cultures were all grown to about the same densities before being transferred to MIV. The old data don't show the kind of dramatic difference I would hope to see if my hypothesis is correct. Time to think about a rigorous test.
Phage recombination
Way back, before we could measures changes in gene expression caused by transfer to MIV, we know that it induced two independently measurable phenotypic changes. The first was that cells became able to take up DNA and recombine some of it into the chromosome. The other was that phage recombination was increased about 100-fold.
What is ‘phage recombination’? When cells are co-infected with two different mutant strains of the same phage, their DNAs can recombine in the cell while they are replicating, giving rise to some phage genomes that have neither mutation. For H. influenzae, we used three different temperature-sensitive mutants of the phage HP1, which could form plaques at 32°C but not at 40°C. Co-infecting non-competent cells with any two of these gave a very low frequency of recombinant phage, measured as plaques on lawns of cells grown at 40°C. But co-infecting competent cells gave about 100-fold more recombinant plaques.
This increased phage recombination was interpreted (by me and others) as evidence that transfer to MIV induced both DNA-uptake machinery and recombination machinery. I was looking for a way to distinguish between mutations that just knocked out a component of the uptake machinery and those that knocked out the regulatory machinery cells used to decide to become competent. So I used phage recombination to categorize mutants as regulatory or mechanistic - hypothesizing that mutations that eliminated both uptake and phage recombination were probably regulatory, as they affected two independent processes, whereas mutations that knocked out uptake but still induced phage recombination probably affected just a component of the uptake machinery.
Now we know which genes are induced by transfer to MIV. None of them qualify as recombination machinery. But this wasn't bothering bother me for two reasons. First, I’d decided that cells take up DNA as a source of nutrients, so I didn’t expect recombination to be induced. Second, I’d forgotten all about the induction of phage recombination and my former interpretation of it.
But today I was reading my old (before we did microarrays) notes about all the competence genes we knew of, and one note mentioned a mutant that had very little phage recombination but that I now know is part of the CRP-S regulon. This gene is comM; it specifies a protein that somehow protects incoming DNA from being degraded by a nuclease or nucleases present in the cytoplasm. It does DNA uptake but its transformation frequency is very low because the DNA is degraded before it can recombine.
EUREKA! This makes sense. The reason phage DNAs can recombine better in normal competent cells than in non-competent cells is that competence induces comM, and the ComM protein prevents the nuclease from degrading the phage DNA recombination intermediates. Recombination intermediates have unusual DNA structures (exposed single strands, ends of strands, and four-way connections called Holliday junctions) which are vulnerable to general and specialized nucleases.
Another gene, dprA, does something similar. Mutations in dprA also allow incoming DNA to be rapidly degraded, and DNA brought in by the DNA uptake machinery doesn’t survive long enough to recombine with the chromosome. In my old notes I think I have data for its phage recombination - I bet it’s low. (Later - yes, it is.)
I have been hypothesizing (without any direct evidence) that both comM and dprA have evolved to be competence-induced because their jobs are to protect stalled replication forks from nucleases. Stalled replication forks have a lot in common with recombination intermediates; they often get into tangles that are structurally indistinguishable from the Holliday intermediates produced by recombination. I wonder if I can use phage recombination in some way to help sort this out?
(Note to self: The above sounds great, but don't forget the complication that the rec2 mutant also has low phage recombination, which is unexpected because we've been pretty sure it acts in DNA transport across the inner membrane.)
Too many questions
I just numbered the questions my draft grant proposal proposes to answer, and found that I have 19 questions! This is far too many, unless I'm asking for a zillion dollars, and I know I don't have the skills to administer that big a project.
But some of the questions are much more important and much more substantial than others. So I'll turn some of them into 'subsidiary questions' and "if time permits" questions. I would rather not simply leave them out, because then the grant panel will just complain "Why isn't she proposing to do X?".
But some of the questions are much more important and much more substantial than others. So I'll turn some of them into 'subsidiary questions' and "if time permits" questions. I would rather not simply leave them out, because then the grant panel will just complain "Why isn't she proposing to do X?".
The controversy surrounding the function of DNA uptake
I'm holed up in Indio California, in a "RV Resort" for retirees, working on my grant proposal and checking out the local attractions (Washingtonia palms! The Salton Sea!).
Here's a few paragraphs from the proposal introduction, explaining the big question:
The consequences of DNA uptake are not in question. A cell that takes up DNA inevitably incurs the physiological costs of becoming competent and of transporting the DNA across its envelope. The cell also inevitably gets the incoming DNA’s nucleotides, reducing the demands on its biosynthetic or salvage pathways. Because DNA is abundant in natural environments, and nucleotides are very expensive to synthesize, the nucleotide benefit may be sufficient to compensate for the costs and thus to explain the evolution (origin and continuation) of competence. However if the incoming DNA recombines with the chromosome it may also change the cell’s genotype, which may increase or decrease the cell’s ability to survive and reproduce. The controversial question is whether natural selection on the machinery and regulation of DNA uptake has been influenced by these genetic consequences.
The conventional view is that bacteria take up DNA for recombination (i.e., that recombination has net benefits, and that these are sufficient to account for the evolution of competence). This derives partly from the now-discredited idea that sex in eukaryotes is easily explained by long-term benefits to the species, and partly from observation of ancient beneficial recombination events in bacterial genomes and recent ones in the laboratory. But there are also substantial costs to genetic recombination, because the homologous DNA in the environment comes from dead cells and is likely to carry excess deleterious mutations, and because recombination with heterologous DNA will usually the cell’s well-adapted genetic machinery. These genetic costs are easily overlooked because natural selection eliminates the cells incurring them.
Understanding the evolution of bacterial competence has major implications for our present far-from-satisfactory understanding of why sexual reproduction evolved in eukaryotes. The problematic hypothesis that meiotic sex evolved to create new combinations of genes is often supported by claims that bacterial ‘parasexual’ processes also evolved for this. Because conjugation and transduction are now known to be side effects of selection for more immediate benefits to cells or their genetic parasites, understanding competence is key. If the genetic consequences of competence have not shaped its mechanism or regulation, we will conclude that bacteria get all the genetic variation they need by accident, and thus that meiotic sex is a eukaryotic solution to a eukaryotic problem.
Direct experimental testing of proposed costs and benefits is not the best approach, because it is all too easy to create selection in bacterial cultures, and because laboratory conditions in no way replicate those of the natural environment. Rather, the best way to understand the evolution of competence is to understand its regulation and mechanism. Regulation is informative for all bacteria, as the genes that regulate competence evolved in the natural environment, and understanding the signals they respond to will give us a window on the consequences of competence that have been most beneficial. Because H. influenzae’s uptake specificity causes it to preferentially take up its own DNA, understanding the uptake mechanism responsible for this bias is a critical test of the importance of recombination.
Making lemonade
Plasmids carrying the sxy gene often acquire mutations; we have learned (painfully) that we need to recheck their sequences before using them in experiments. Our assumption has been that the Sxy protein is harmful to cells, at least when inappropriately expressed, and that the mutations are selected because they make this expression less harmful. I’ve always just treated this as a nuisance (a major nuisance), an obstacle to be tolerated because I haven’t seen any way to overcome it.
But last night I realized that we might be able to use it as a probe into what Sxy does. Although it's possible that Sxy’s toxic effects on cells have nothing to do with how Sxy induces expression of CRP-S genes, it’s more likely that the two effects are connected.
One obvious candidate connection is that Sxy affects how CRP acts, and perturbs CRP’s normal contributions to maintaining the cell's carbon and energy balance. An even more obvious candidate would be that inappropriate expression of CRP-S genes is toxic. (However the hypercompetence mutations cause such expression without being detectably toxic...) A less obvious but more exciting candidate is that Sxy activates transcription by interacting with RNA polymerase (or a general transcription factor), and that inappropriate expression interferes with transcription at other genes.
So the simple experiment is to propagate a sxy-expression plasmid in H. influenzae (or E. coli) without population bottlenecks (i.e. in a large culture grown for many generations), plate for single colonies, and isolate plasmids and sequence inserts from multiple colonies.
This will probably give a mix of obvious loss-of-function mutations (stop codons, deletions) and amino acid substitution mutations. My recollection of the mutations we’ve seen in the past is that they were mostly substitutions, which is good as these will be the interesting ones. If the majority are loss-of-function mutations we might want a way to screen these out before sequencing. We could do this if we started with a sxy- mutant, although this would need to be a complete deletion so that it wouldn’t recombine with the sxy gene on the plasmid. How would we screen them? Would screening for function be more trouble than it’s worth? I guess this would depend on how common the loss-of-function mutations turned out to be.
Mutations creating stop codons are expected to arise less frequently than simple substitutions (only three of the 64 codons specify STOP). Deletions are also expected to be relatively rare, at least in the absence of predisposing short repeats. So if we found that the majority are loss-of-function mutations, this might itself be our answer. This would tell us that Sxy is intrinsically harmful, and that getting rid of Sxy entirely is much more effective than changing its sequence.
So the first approach would be to sequence every plasmid that was isolated from a reasonably large colony. (Choosing large colonies will reduce the frequency of unchanged inserts.) Then we would compare changes, looking for clustering of substitution mutations. [This sounds like a good project for an undergraduate.] And we would use our anti-Sxy antibody to confirm that the plasmids with substitution mutations still produce full-length Sxy protein.
Then we would characterize the effects of the mutations on Sxy’s ability to induce CRP-S genes, probably by transforming the mutant version into wildtype cells and doing competence assays. We'd also look for effects on any other properties of Sxy we have a handle on, such as pull-down of complexed proteins, or two-hybrid interactions.
Does PurR repression explain the 'FC' results?
A couple of months ago I posted about the 'fraction competent' (FC) assay we use to tell whether only some of the cells in a culture are able to take up DNA. I mentioned that, when we assay cultures that are only partially competent (i.e. have lower transformation frequencies than maximally-induced cultures), we find this to be because some of the cells are taking up multiple DNA fragments and the rest aren't taking up any at all.
This was surprising, as I'd expected that the low transformation frequencies of such 'partially-induced' cultures would be because the cells were all only a little bit competent. We see this max-or-nothing pattern in not only in wild-type cells under poorly-inducing conditions, but also in low-competence mutants under fully inducing conditions and in hypercompetent mutants under what are otherwise non-inducing conditions. I've had this puzzling result hanging around in the back of my brain for about 15 years.
I've always thought that it reflected something about the action of adenylate cyclase, CRP or Sxy, the proteins whose actions control expression of all the genes in the competence (CRP-S) regulon. But yesterday we were talking about how the PurR repressor represses only one of the competence genes (rec-2), and I realized that, because the fraction-competent assays measure only transformation, the max-or-nothing could reflect the activity of a single gene instead or the whole regulon.
So maybe all the cells in our partially-induced cultures have turned on all the competence genes except rec-2, but only in some of them have levels of purines fallen low enough to inactivate the PurR repressor and turn on rec-2. This might be tested by repeating the FC assays on cells whose purR gene is knocked out. But first I need to check the notes from the grad student who created the purR knockout, to see if he already tested this.
Does the USS wrap around the pilus?
Something got me thinking that, rather than kinking during uptake, the USS might facilitate DNA uptake by wrapping itself around the 'type IV' pilus.
We know that these pilus filaments on the cell surface are required for DNA uptake in many bacteria including H. influenzae. Some of these bacteria make long pili, and others (including our H. influenzae strain) just make what are probably short stubs, too short to be seen by scanning electron microscopy. We also know that DNA can bind to the pili of Pseudomonas aeruginosa.
I have been discounting this idea because I remember reading an article that, in a species whose uptake had sequence specificity, substituting the normal pilin gene with one from a species with no uptake specificity didn't change the cell's uptake specificity. BUT, I can't remember the details, and I can't find the article, so maybe I was wrong. The bacteria were probably Neisseria gonorrhoeae or Neisseria meningitidis; it wasn't H. influenzae or one of its close relatives, and the Neisserias are the other group of bacteria with uptake specificity. I should probably email either the Neisseria people or the woman who did the pilin-binding work in P. aeruginosa to see if they can point me to the paper. In any case, the Neisseria USS is unrelated to the H. influenzae USS, so I should consider testing this for H. influenzae.
I was thinking that the DNA would need to wrap 'paranemically' around the pilus - this term means that the DNA and the pilus aren't topologically interlinked like links in a chain, but just snuggle up to each other like... like... (can't think of a good analogy). But if the pili are just short stubs this distinction doesn't matter.
How could we test this? The conceptually simplest way (i.e. the only idea I have right now) is to mix USS-containing and control DNAs (circular? linear?) with purified H. influenzae and look for evidence of conformation change ( pililigatability of the ends) or of DNA-protein interactions (protection from nucleases? interference by ethylation?).
Unfortunately there's no way to purify the hypothetical short stub pili that our strain probably makes, but I can think of several possible solutions. One is to overexpress the pilin gene (pilA) under conditions where pili can assemble. This might work in our H. influenzae strain, or we could overexpress the gene in a different species whose own pilin gene is knocked out. If the pilin subunits won't assemble into pili, we might be able to purify the pilin subunits from such an overproducing strain and make them reassemble in vitro. Maybe the best solution would be to use a different strain, as some H. influenzae strains are reported to produce long pili.
(Hooray! While searching for the paper about H. influenzae strains that produce type 4 pili, I found the paper that showed that replacing a Neisseria pilin with one from P. aeruginosa didn't change uptake specificity. I'll need to read it carefully - it's quite dense.) I found the H. influenzae pili paper, and the strain they describe is one that we have in the lab. The authors don't report purifying the pili, but maybe we wouldn't need to do this. The next step is to get in touch with them, in case they are working on pilin-DNA interactions themselves. We wouldn't want to compete with them, but maybe we can collaborate.
Fructose? Why not glucose?
One of the grad students has new data showing that the active form of the regulatory protein CRP is needed not only for expression of the CRP-S genes coregulated by the Sxy protein, but for expression of Sxy itself. This has reminded me of a puzzle in our understanding of how cyclic AMP (cAMP), the activator of CRP, depends on sugar uptake.
Many bacteria have evolved to use cAMP as a signal that supplies of energy and carbon are running low, and the concentration of cAMP in the cell is controlled mainly by a sugar-uptake pathway called the phosphotransferase system (PTS). This is a cluster of membrane-associated proteins that bind specific sugars in the cell's environment, bring them across the membrane, and stick a phosphate group onto them so they can't leak back out. Each kind of PTS sugar (glucose, fructose etc.) has one or two specialized proteins to take it up, in addition to the generalist proteins that bring in the phosphate and set the stage. (Some other sugars don't use the PTS at all - these are usually less common sugars.)
The PTS uses the availability of its sugars to control the synthesis of cAMP. If lots of sugar is being transported, no cAMP is made. But if sugar supply runs out, the PTS stimulates synthesis of cAMP. This in turn activates CRP to turn on genes for using other (non-PTS) sugars and for conserving other energy resources. Bacteria differ in the sugars their PTS systems can handle, depending on the environment they're adapted to. E. coli, for example, has PTS uptake proteins for many different sugars, because it lives in the gut.
When the H. influenzae genome sequence first became available, we checked it for genes encoding PTS transport proteins. We were a bit surprised to find only proteins for transporting one sugar, and more surprised that this sugar was fructose, not glucose. Because we had shown that H. influenzae uses its PTS to control cAMP levels and thus to control the activity CRP, this meant that the availability of fructose was a major factor in the cell's decision to take up DNA.
This was surprising because I had assumed that glucose was the primary sugar in human bodily fluids, including respiratory mucus (H. influenzae's environment). I was told that in fact fructose might have evolutionarily precedents - the ancestral PTS may have transported fructose. And I found out that there was significant fructose in at least some bodily fluids, though not much in our blood unless we'd been consuming sugar (sucrose is a glucose+fructose dimer ). Nevertheless fructose seemed an odd choice for the sugar regulating CRP activity, and I kept wondering whether the absence of a glucose PTS uptake protein was a peculiarity of the lab strain of H. influenzae rather than a general property of the species.
That was 11 years ago, and now we have genome sequences of several H. influenzae strains and of 8 or 9 other Pasteurellacean species. So I did some searching for the glucose and fructose transporters, and found that I was wrong. None of the other H. influenzae strains have genes for glucose PTS proteins, and neither do about half of the other species in H. influenzae's family. Nor do they all have genes for fructose PTS proteins. The distributions of these genes doesn't perfectly match the phylogenetic relationships of the species, suggesting that genes may have been lost (or gained) several times. (Ravi Barabote and Milton Saier review the PTS genes in all bacteria: (2005) MMBR 69:608-634.)
So I'm still perplexed. CRP regulates a large number of genes in H. influenzae, and I would think there would be strong selection to optimize the regulatory machinery that decides when these genes should be turned on. But these bacteria seem to have been very cavalier (careless) in looking after the PTS genes that control this decision. This might mean that PTS regulation of cAMP isn't really such a big deal, or it might mean that the bacteria know things I don't about how glucose and fructose levels vary in their environments.
GeneSpring not needed?
Several years ago we did quite a lot of microarray work, looking at changes in gene expression as wildtype cells developed competence and in response to various mutations and culture conditions. The analysis was greatly helped by use of GeneSpring software, which displayed the results in various intuitive and insight-increasing ways.
But the GeneSpring company charged us about $3500 ($US) per year to run their software on a single computer, so when the work was done we let the subscription lapse. Lately I've been wanting to look at some of the old microarray data, but dreading the hassle involved in getting GeneSpring set up again. We wouldn't need to pay for a subscription, as another lab in the BARN research group has it and would let us use it. But my past experience setting up our data on Genespring means that I expect hours and hours of fussing and fiddling with incompatibilities and upgrades and emailing tech support and the people in London who made the arrays, etc.
But this afternoon I realized that I don't need GeneSpring to look at the data. We have simple text files of the array data that I can open in Excel. I won't see pretty visualizations of genes and sequences and colour-coded expression ratios, but I can look up the numbers for the signal intensities of different genes under different conditions.
If I needed to look at a lot of genes, or under a lot of conditions, setting up GeneSpring would be worth the trouble. But I think I only need to check a few critical genes under a couple of conditions. The only problem will be finding the files I need, and I'm pretty sure I know where they are.
Transformasomes?
At one time DNA uptake was thought to be mediated by membrane-bound vesicles called transformasomes (Goodgal and Smith lab papers). These structures appear as surface 'blebs' in electron mocrographs of competent H. influenzae and H. parainfluenzae and to a lesser extent on non-competent cells. Blebs often contain DNA which is inaccessible both to externally added nucleases and to the restriction enzymes present in the cell's cytoplasm. They appear to be internalized on DNA uptake (only in H. para?), and are shed into the medium by some competence mutants and when normal cells lost competence. Purified blebs bind DNA tightly and with the same specificity as intact cells but do not internalize it (???).
The name transformasomes resulted from the interpretation that these blebs were structural adaptations for DNA uptake. However microbiologists have subsequently realized that similar blebs are often produced when gram negative bacteria are stressed (Beveridge papers), and they are no longer thought to be specialized for DNA uptake. Rather, they are thought to contain DNA uptake machinery only because this is located in thecell envelope from which the blebs form.
However, it is still possible that those parts of the envelope containing the DNA uptake machinery are particularly likely to form blebs. The proposal will describe using competence mutants to test this. Even if blebs are not enriched for DNA uptake machinery relative to the cell envelope, they lack all of the cytoplasmic proteins and this may be a valuable tool for characterizing competence-specific proteins and protein-DNA interactions. Their ability to bind DNA tightly without taking it up will be especially useful.
Getting the kinks in
I'm finally digging in on the grant proposal planning, with the goal of having a presentable draft before Christmas. A colleague in the US has agreed to critique it for me and I want to give him lots of time, and myself lots of time to fix it up once he's done.
I think I'm going to propose to test my hypothesis that DNA forms kinks at the USS during uptake.
Because the need to invoke kinks arises because cells can take up circular DNA molecules, I wonder if we should replicate the old experiments showing that closed circular molecules are efficiently taken up. There are lots of papers where circular plasmids were transformed into competent cells, but in these there was no analysis to rule out effects of nicked or linear plasmids contaminating the preparation. But I found the best paper, and the data looks quite solid. They used a preparation of closed circular molecules that gave a ladder of bands in gels, indicative of different extents of supercoiling, and the ladder was preserved in the DNA they later reextracted from cells that had taken the plasmids up. This confirms that the circular molecules were taken up.
It's possible that the kink arises because the DNA is nicked during uptake (it's easy to bend DNA sharply at a nick), but if so the nick must be resealed without changing the degree of supercoiling. This would require a specialized nicking enzyme for which we have no evidence. However we do have evidence of a ligase in the periplasm that could reseal nicks, though no idea why this would be beneficial.
So how does DNA form kinks? This time my literature searching led me into an area I'd missed previously - the ability of very short fragments to be ligated into circles. Linear DNAs longer than 200bp are easily ligated because the molecules spontaneously bend in smooth curves that (sometimes) bring the ends together. But shorter molecules (e.g. 100bp) were thought to not do this because their smooth curves would be too short - they'd make semicircles with the ends far apart instead of complete circles.
However Jon Widom's lab showed a few years ago that 100bp fragments form circles much more efficiently than anyone had expected, and this has directed attention to how spontaneous fluctuations in DNA structure cause transient kinking. One way this can happen is by formation of one or more internal bubbles (unpaired bases), because it's the base pairing that gives DNA its stiffness. Kinks can also be promoted by DNA-binding proteins that not only undo base pairs but flip one base out of the double helix
One issue that I don't think has been resolved is the extent to which the fluctuations only happen with short fragments. The ends of any double-stranded DNA molecules are known to spontaneously 'breathe', unzipping the terminal base pairs and zipping them up again due to thermal noise. In very short fragments this could affect base pairing throughout the fragment, facilitating formation of internal bubbles and kinks.
Pinning down the covariation
The Defining-the-USS paper needs one last analysis. I wrote earlier that the set of sites most likely to reveal the uptake bias is those that are neither in genes nor likely to function as transcriptional terminators. I have this set (490 sites) and I've made a logo (here).
I also did a MatrixPlot analysis to look for covariation between bases at different positions. (I've posted about using MatrixPlot to analyze the whole-genome set here.) It showed stronger interactions than those seen in the whole-genome set. But I'm left with two unresolved issues.
First, I don't know how strong the covariation is, because MatrixPlot's statistical underpinnings aren't explained (or aren't explained in a way that's accessible to my statistically untrained mind). I can take care of this by doing a control analysis, using the same number of input sequences taken from random positions in the genome - this control is on hold because the MatrixPlot server is down. (I guess really this control should use random intergenic positions - I could do that.) This is a valid control even though it doesn't use any statistics.
Second, when MatrixPlot detects covariation between two positions it doesn't tell me which combinations bases are found together more often than expected. For example, it usually reports that the base at position 18 (in the first flanking segment) is strongly correlated with the base at position 19. Both A and T are common at both of these positions, but MatrixPlot doesn't tell me whether the significant combinations are AA or AT or TA or TT.
My colleague Steve Schaeffer's linkage disequilibrium program will do that, so I'm about to email him and ask him to run the unconstrained (non-coding non-terminator) and control sets for us. But I want to get the control MatrixPlot results first, so I can more clearly explain what we think is going on.
A genuinely unbiased motif
In a previous post I showed logos from four replicate Gibbs analyses of Goodgal and Mitchell's set of plasmid insert sequences. Because the replicates didn't produce identical motif sites, the logos differed. I've now done 10 replicate runs (each testing 100 seeds) and pooled the results to create a single logo.
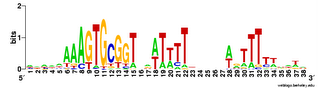 Not only did the different replicates find different numbers of sites (between 21 and 28), they settled on motifs with slightly different centers and (once) a different length. This gives me more confidence that this consensus logo represents most of the variation in sites.
One remaining concern is that these searches were not unbiased, in that I started them all with a 'fragmentation mask' that specified the positions of gaps in the motif. See this post for an explanation. What would a completely unbiased search find? I suspect it will close the gaps, and ignore the consensus at positions that aren't close to the core, as this is what happens in unbiased searches of the genome. But I should try (now).
...Short break while I do this (28 short sequences means it runs very fast)...
Well I'll be hornswoggled! (Sorry, Language Log influence.) It found the reverse version of the full USS motif!
...Another slightly longer break while I do ten replicate runs...
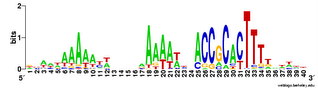 And here's two versions of the logo from the unbiased searches. The top one is what the searches find - the USS motif in reverse orientation . The lower logo is the reverse complement of this (same data, but in back-to-front order and with all the As
 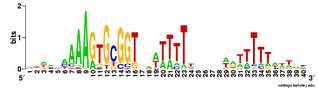 changed to Ts, Ts to As, Gs to Cs and Cs to Gs).
This 'unbiased' motif is actually a better match to the genome consensus than is the motif I got using the fragmentation mask. How nice!
I've been (sometimes) putting 'unbiased' in quotes, because I don't think any pattern search can be truly unbiased. The Gibbs motif sampler program I'm using for these searches has a bias towards compact motifs - there's a built-in penalty for introducing gaps.
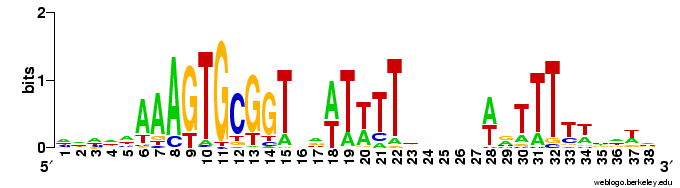 Not only did the different replicates find different numbers of sites (between 21 and 28), they settled on motifs with slightly different centers and (once) a different length. This gives me more confidence that this consensus logo represents most of the variation in sites.
One remaining concern is that these searches were not unbiased, in that I started them all with a 'fragmentation mask' that specified the positions of gaps in the motif. See this post for an explanation. What would a completely unbiased search find? I suspect it will close the gaps, and ignore the consensus at positions that aren't close to the core, as this is what happens in unbiased searches of the genome. But I should try (now).
...Short break while I do this (28 short sequences means it runs very fast)...
Well I'll be hornswoggled! (Sorry, Language Log influence.) It found the reverse version of the full USS motif!
...Another slightly longer break while I do ten replicate runs...
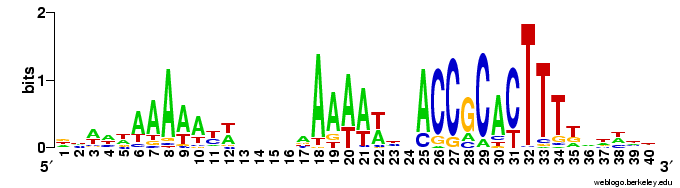 And here's two versions of the logo from the unbiased searches. The top one is what the searches find - the USS motif in reverse orientation . The lower logo is the reverse complement of this (same data, but in back-to-front order and with all the As
 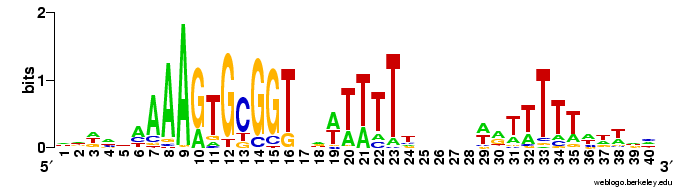 changed to Ts, Ts to As, Gs to Cs and Cs to Gs).
This 'unbiased' motif is actually a better match to the genome consensus than is the motif I got using the fragmentation mask. How nice!
I've been (sometimes) putting 'unbiased' in quotes, because I don't think any pattern search can be truly unbiased. The Gibbs motif sampler program I'm using for these searches has a bias towards compact motifs - there's a built-in penalty for introducing gaps.
The post-doc and I sat down and went over the results we have for our 'defining the USS' manuscript. In doing this I realized that my idea about the differences between intergenic and coding USSs was wrong.
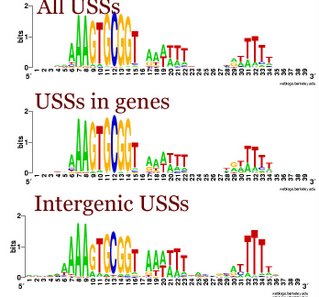 I had been thinking that the differences were due as much to the terminator function of many intergenic USS as to the coding constraints on the USSs in genes. But when we looked at the logos for the terminator and non-terminator classes of intergenic USSs, we saw that they were quite similar. Compared to the whole-genome USS logo, both showed the strong AAA at the beginning, and strong flanking motifs, especially the TTT at the end. In both the GTGCGGT of the core was also weaker. These patterns are also seen in the logo of all the intergenic USSs to the left.
The USSs-in-genes logo (the sum of all 6 reading-frame specific logos I posted a week or so ago) is much more similar to the whole genome logo. This is perhaps not surprising, because most USSs are in genes.
But the similarities of the non-terminator and terminator USSs to each other means that the importance of the initial As and final Ts isn't due to selection for forming a terminator, but to the function of the sequence in DNA uptake. (On reading back over what I posted last week, I see I was pretty much thinking the same thing then. But somehow between then and this morning I got led astray.)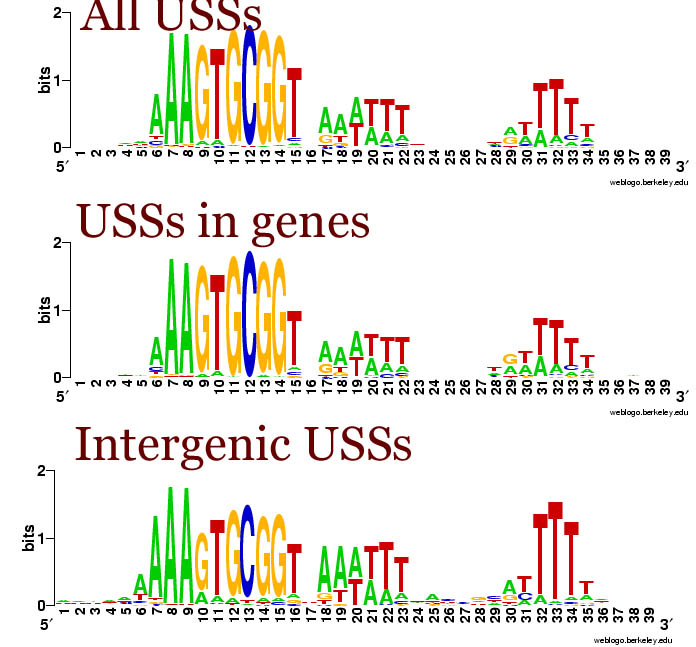
Reanalyzing old uptake data
I've been using the motif patterns identified by the Gibbs motif sampler to reanalyze old DNA uptake data. My goal is to see if the published uptake differences correlate well with motif scores that reflect match to the pattern of genomic USSs. That is, how similar is the uptake bias to the sequences that accumulate in the genome. We've independently done our own experiments to examine this correlation, but I like the notion of finding more value in old data. (A good scientist is a lazy scientist.)
So I've been using Patser (on RSAtools) to generate a motif score for each 'suitable' fragment. To be suitable, the sequence of the fragment is available (either from the original authors or from subsequent sequencing projects) and the uptake data must be quantitative. It's not enough that the original paper provided images of gels showing that some fragments were taken up better than others; I need numerical measures of uptake. In the best data (from Sol Goodgal and Marylin Mitchell) the uptake is reported as numbers of molecules taken up per cell under standard conditions. In another experiment (Danner et al 1982) uptake is presented as % relative to a standard fragment. Several other papers describe uptake results qualitatively ('strong', 'weak', 'undetectable'), and may show gels, but I can't use these.
 Here are the results. The blue and red points are data from Goodgal and Mitchell, and the green ones from Danner et al.
Goodgal tested a set of 28 plasmids for uptake, reporting the results as plasmid molecules taken up per cell. These are the blue points.; they form two clear clusters. Cells take up fewer than 30 molecules of plasmids with USS scores less than about 8, and take up between 65 and 80 molecules of plasmids with USS scores better than 9.
(Oops, I forgot to take into account the sequence of the plasmid vector the genome fragments were cloned into. This is pUC18. So I just got the pUC18 DNA sequence (Googled it), tidied it up by removing spaces and line breaks, and ran it through Patser to see if it has any USS-like sequences. This gave four surprisingly high scoring sequences - the scores are all between 10-5 and 11.5, but these sequences don't look anything like USSs to me. I'll need to think about this some more, but as all the tested plasmids were in the same vector I don't think this compromises the results.)
The red points are from the same data set. Goodgal and Mitchell purified the insert fragments from 15 of their plasmids and tested them again, this time measuring the % of the DNA that was taken up but not converting this to the number of molecules per cell. (Hmm, I wonder if I could do that myself? They say they used about 0.01µg of fragment per 0.1ml cells (about 10^8 cells, because they used 0.1ml of competent cells, and these are usually at about 10^9 cells/ml). Using Rosie's universal constant (a 1kb fragment weighs 10^-18g), and some dimensional analysis, I see that molecules taken up per cell = 1000 x %uptake/fragment size in bp.) OK, I'll go back later and make the conversion.
The green points are from Danner et al'.s analysis of synthetic USSs they constructed using the then-new ability to sequence DNA oligomers of desired sequence. Their results were reported as the amount of uptake relative to a DNA fragment that had already been shown to be taken up quite efficiently (they used this fragment as an internal control in each uptake assay they did). To conveniently fit their numbers on the graph above I multiplied each relative-uptake value by 0.5.
Does it matter that I threw in this fudge-factor of 0.5? I think not, because the numbers are all relative to an arbitrary internal standard for which I have no absolute uptake data. My main goal is to see whether better uptake correlates with a better score, and in general it does. I'm not going to try to draw any more detailed conclusions.
So I've been using Patser (on RSAtools) to generate a motif score for each 'suitable' fragment. To be suitable, the sequence of the fragment is available (either from the original authors or from subsequent sequencing projects) and the uptake data must be quantitative. It's not enough that the original paper provided images of gels showing that some fragments were taken up better than others; I need numerical measures of uptake. In the best data (from Sol Goodgal and Marylin Mitchell) the uptake is reported as numbers of molecules taken up per cell under standard conditions. In another experiment (Danner et al 1982) uptake is presented as % relative to a standard fragment. Several other papers describe uptake results qualitatively ('strong', 'weak', 'undetectable'), and may show gels, but I can't use these.
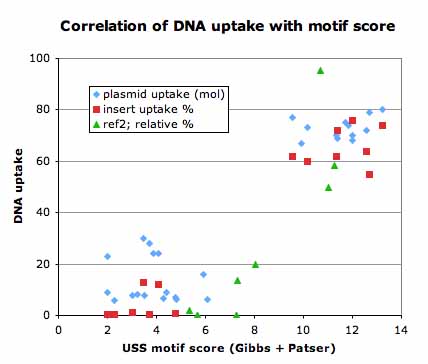 Here are the results. The blue and red points are data from Goodgal and Mitchell, and the green ones from Danner et al.
Goodgal tested a set of 28 plasmids for uptake, reporting the results as plasmid molecules taken up per cell. These are the blue points.; they form two clear clusters. Cells take up fewer than 30 molecules of plasmids with USS scores less than about 8, and take up between 65 and 80 molecules of plasmids with USS scores better than 9.
(Oops, I forgot to take into account the sequence of the plasmid vector the genome fragments were cloned into. This is pUC18. So I just got the pUC18 DNA sequence (Googled it), tidied it up by removing spaces and line breaks, and ran it through Patser to see if it has any USS-like sequences. This gave four surprisingly high scoring sequences - the scores are all between 10-5 and 11.5, but these sequences don't look anything like USSs to me. I'll need to think about this some more, but as all the tested plasmids were in the same vector I don't think this compromises the results.)
The red points are from the same data set. Goodgal and Mitchell purified the insert fragments from 15 of their plasmids and tested them again, this time measuring the % of the DNA that was taken up but not converting this to the number of molecules per cell. (Hmm, I wonder if I could do that myself? They say they used about 0.01µg of fragment per 0.1ml cells (about 10^8 cells, because they used 0.1ml of competent cells, and these are usually at about 10^9 cells/ml). Using Rosie's universal constant (a 1kb fragment weighs 10^-18g), and some dimensional analysis, I see that molecules taken up per cell = 1000 x %uptake/fragment size in bp.) OK, I'll go back later and make the conversion.
The green points are from Danner et al'.s analysis of synthetic USSs they constructed using the then-new ability to sequence DNA oligomers of desired sequence. Their results were reported as the amount of uptake relative to a DNA fragment that had already been shown to be taken up quite efficiently (they used this fragment as an internal control in each uptake assay they did). To conveniently fit their numbers on the graph above I multiplied each relative-uptake value by 0.5.
Does it matter that I threw in this fudge-factor of 0.5? I think not, because the numbers are all relative to an arbitrary internal standard for which I have no absolute uptake data. My main goal is to see whether better uptake correlates with a better score, and in general it does. I'm not going to try to draw any more detailed conclusions.
USS as terminators
I've more-or-less finished the analysis of USSs in non-coding parts of the genome. I say more-or-less because I never did get the Gibbs searches to work properly on the correct set of intergenic sequences, even after I took the advice of the Gibbs expert and replaced all the sequences less than 30nt with long strings of 'n's.
But the Gibbs searches would sometimes run correctly if I only asked them to test 1 or 2 or 3 seeds, so I got some useful data. Here are the results. This logo shows the pattern for the 490 USSs that are neither in coding sequences nor in positions where they are likely to function as transcriptional terminators. So this represents those USSs that are least functionally constrained.
For comparison, here is the logo for all the USSs Gibbs finds in the genome (2136). You can see that the initial As and final Ts are stronger (larger) in the least-constrained USSs. This also makes the USS pattern more strongly palindromic, so it is symmetric when both DNA strands are considered. To me this suggests that the DNA may kink in the middle, between positions 19 and 20, with base-pair interactions between the initial As and terminal Ts. Tomorrow morning I'm meeting with a structural biochemist who probably set me straight about this. Her main expertise is in protein structure, but at least she'll be able to point me to the best sources of information about DNA kinking.
And here is the complementary logo, based on only the 223 USSs that are both in non-coding regions and in oppositely-oriented pairs close enough to together act as a transcription terminator. The initial As and terminal Ts are still very strong, but now we see a new ACCGCAC pattern on the right, capable of base pairing with the GTGCGGT bases on the left. I'm going to have to think more about what this means, as I can't just say "It reflects functional constraints...". (My thinking will mostly consist of drawing sketches on the whiteboards in the hall outside my office.)
But the Gibbs searches would sometimes run correctly if I only asked them to test 1 or 2 or 3 seeds, so I got some useful data. Here are the results. This logo shows the pattern for the 490 USSs that are neither in coding sequences nor in positions where they are likely to function as transcriptional terminators. So this represents those USSs that are least functionally constrained.
For comparison, here is the logo for all the USSs Gibbs finds in the genome (2136). You can see that the initial As and final Ts are stronger (larger) in the least-constrained USSs. This also makes the USS pattern more strongly
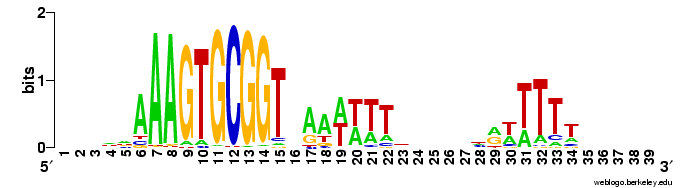 palindromic, so it is symmetric when both DNA strands are considered. To me this suggests that the DNA may kink in the middle, between positions 19 and 20, with base-pair interactions between the initial As and terminal Ts. Tomorrow morning I'm meeting with a structural biochemist who probably set me straight about this. Her main expertise is in protein structure, but at least she'll be able to point me to the best sources of information about DNA kinking.
And here is the complementary logo, based on only the 223 USSs that are both in non-coding regions and in oppositely-oriented pairs close enough to together act as a transcription terminator. The initial As and terminal Ts are still very strong, but now we see a new ACCGCAC pattern on the right, capable of base pairing with the GTGCGGT bases on the left.
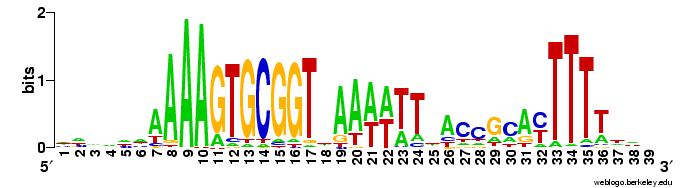 I'm going to have to think more about what this means, as I can't just say "It reflects functional constraints...". (My thinking will mostly consist of drawing sketches on the whiteboards in the hall outside my office.)
Oh right, the grant proposal...
Research is fun, and it's easy to get so caught up in the day-to-day problems and discoveries that I put off addressing the longer-term goals. Such as the need to prepare a compelling research proposal that will get us lots of grant money for the next 3-5 years. (Only the best proposals get money for 5 years; the rest get it for 3.)
One of the post-docs has been doing a lot of thinking about how to study the DNA uptake machinery - this will be the main focus of the proposal. Yesterday we talked about her idea of using the little membrane 'blebs' that fall off of bacterial cells as sources enriched for the proteins of the uptake machinery (a great idea). Today she asked me about genetic approaches, quoting a maxim from Stanley Maloy, a superb bacterial geneticist and one of her instructors in the Cold Spring Harbor course in Advanced Bacterial Genetics. Stanley said something to the effect of "Protein work is all very well, but there's usually a better way that uses genetics."
So we talked about a series of experiments the lab started several years ago, which aimed to use genetic complementation to identify the gene encoding the sequence-specific part of the uptake machinery. The experiments ran into various sorts of technical and personnel problems (the technician went to South America and I had other responsibilities) and never produced the results we wanted. But now I think we're going to revive them. The post-doc brought back new methods from the Cold Spring Harbor course that will make the analysis more powerful, and she has the time and skills to focus on this problem. If nothing else the plan will be a strong part of our grant proposal.
New conclusions from old data
Finally I'm moving on to reanalyzing the old data. I posted about this back in August (New bottles for old wine?) but I'm only now getting back to it. The best old data is a set of 28 short DNA sequences of plasmid inserts that were preferentially taken up by competent H. influenzae cells., and the amounts of each that the cells took up. I can do two things with this data.
 First, I can use the Gibbs motif sampler to search it for USS-like patterns. This provides one direct estimation of the bias of the uptake machinery. Here are some replicate results. All of these searches used the same dataset, but random differences in the search runs produced different datasets, which produced different logos. I haven't gone back and compared the outputs to see how many of the same sequences they found, but that will only take a few minutes to do, using Unix's 'diff' command.
Second, I can find out how well the uptake of these sequences is predicted by their degree of match to the genomic USS pattern. I know that I can use a program called PatSer (for Pattern Search, I guess) on the RSA Tools site to do this. It constructs a scoring matrix and then scores sequences you give it. The matrix will be constructed from the probability matrix that the Gibbs searches produce, but I need to ask one of the graduate students to help me do this. Once I have the scores, I'll plot a graph of molecules taken up as a function of PatSer score - a strong correlation would support the hypothesis that biased uptake is responsible for the accumulation of USS in the genome.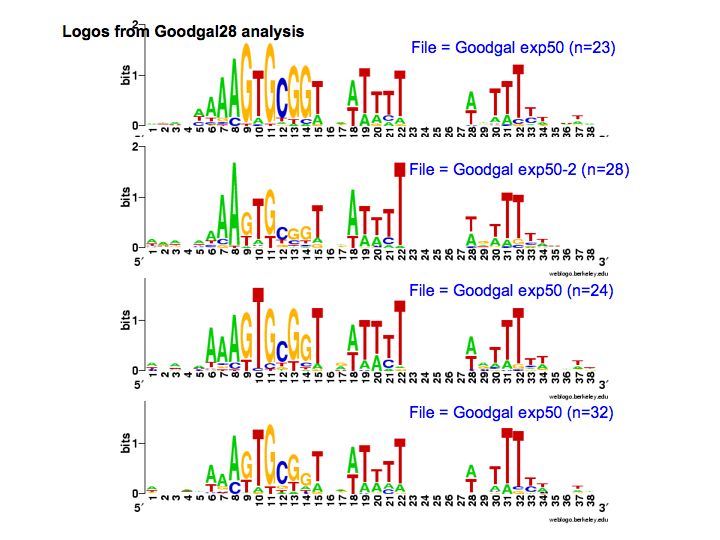
Palindromes Lost (when I figure out how)
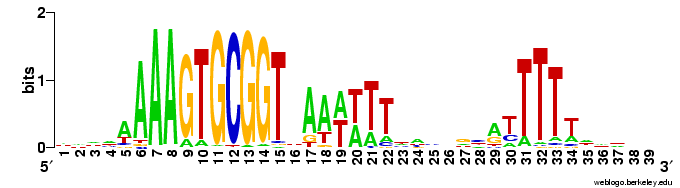 In addition to the just-posted analysis of genes in coding segments of the genome (the genes), I've analyzed the USSs in the non-coding ('intergenic') segments. Here's the logo.
It's a bit different than the in-gene logos in the previous post, and than the whole-genome (genes + intergenic) logo below. At first I was thinking "Great! This logo represents the unconstrained USS, because these USSs don't have to code for protein and so evolve only because of the biased DNA uptake machinery.

But then I realized I was forgetting about the other function that some USSs appear to have, as molecular signals marking the ends of genes. These 'stop here' signals (called transcription terminators) usually are formed by a palindromic sequence whose RNA can form a GC-rich stem-loop, followed by a short run of Ts (here's an old post that explains palindromes). USSs can do this because two USSs in opposite orientations form a potential palindrome. USSs are over-represented in non-coding regions, and they are particularly common as oppositely-oriented pairs just past the 3' ends of coding regions. RNA transcribed from one of these USSs pairs can form a GC-rich stem, and if the downstream USS is in the forward orientation this will be followed by a run of Ts. Thus these USS pairs are thought to function as transcription terminators.
Only a small subset of all USSs are in pairs that can do this, but they're all in the intergenic regions, and natural selection for the ability to terminate efficiently may constrain the effects of uptake bias. So I really ought to remove the potential terminator USSs from my intergenic dataset before I claim that it represents the unconstrained effects of uptake bias.
This is easier said than done. My initial 'clever' strategy was foiled when I realized I'd made inconsistent changes to the forward and reverse-complement versions of the intergenic sequence set. These changes didn't affect the motif search at all, but they mean that I can't use the motif-search results I have to find pairs of oppositely-oriented USSs. So I queue'd up yet more Gibbs searches, this time searching a single sequence set in both directions. These should show me where the close pairs of USSs are. Then I found a great web site that does all sorts of useful analyses for repeats. (Well, I 'found' it because a new paper from another lab, analyzing USSs in a related species, describes using this site.) The site is great, but sorting out the strands and the directions made my head spin, so I'm waiting for the Gibbs searches to finish before I decide where to apply my limited brain power.
USSs framed
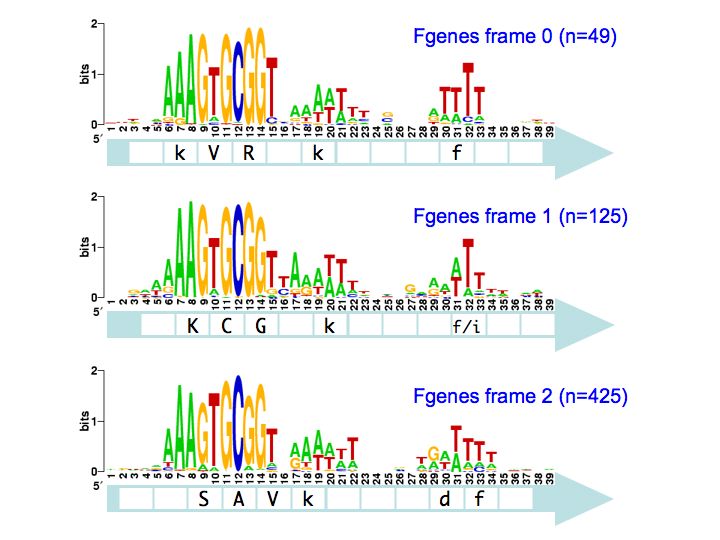
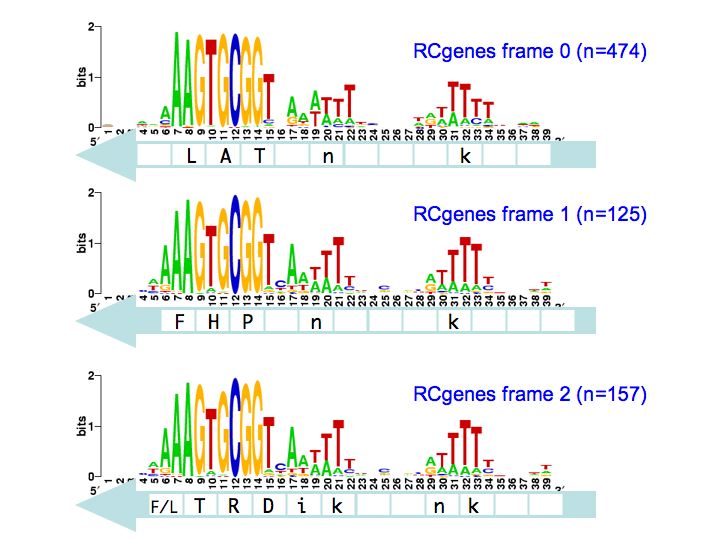
I've finished the reading frame analysis and here are the results. Each logo shows the pattern for the within-gene USSs in a specific position and orientation with respect to the reading frame of the genes they are in. The light-blue arrow below each logo shows the direction in which those USSs' genes are translated into proteins The white boxes superimposed on the arrows show the codons, with the one-letter amino acid code for those amino acids that are more- or less- strongly specified by the USS bases.
So the top left logo summarizes the 49 USSs whose positions and reverse orientation in their genes has their cores specifying the amino acids lysine (K; AAA), valine (V; GTG) and arginine (R; CGG). The consensus of the flanking regions are strong enough that they also are likely to specify particular amino acids, in this case another lysine and a phenylalanine (f; TTT). I put these last two letters in lower case to indicate that the consensus is relatively weak.
So what does this mean? We're still thinking about that. The numbers of sites (n=#, in blue) are sufficiently large that the differences between the logos are significant. I hope we will be able to correlate them to the specific coding constraints, but that's a complex analysis I'm not quite ready for yet.
Framing in progress...
Last night I did the first reading-frame analysis of USS consensuses, but only the forward three frames because I wanted to create reverse-complement sequence sets to search for the reverse three reading frames (I made the sets and ran the searches overnight). The results were interesting (yes, frame affects the consensus) but not shocking.
This morning I did the first combined analysis of all the USS in the intergenic regions. That showed more dramatic differences from the usual whole-genome consensus but I'm not sure how solid the result is, because I had only one compatible pair of forward and reverse-complement results, and both were skewed to the left of the usual motif. I have lots of results, but the forward searches almost always find a differently-centered motif than the reverse searches, so the results can't properly be compared. So I've queue'd more searches, hoping I can
This morning I thought I had plenty of results to analyze the reverse frames, until I discovered that I'd made an error in one of sequence sets (pasted in duplicates of about 100 gene sequences). So I fixed that sequence set and the searches are running again.
I also used the forward-gene and intergenic results I have to look for covariation between different USS positions in these specialized sets - nothing striking turned up.
Framed?
In between thinking about the sxy manuscript (yes, it's getting closer to being done), I'm making progress on the motif analysis.
One big issue arises because about 70% of the USS are in sequences that also code for proteins. So these sequences have two different evolutionary forces acting on them. First, they must continue to code for proteins that function well - any new USS that compromise the function of the part of the proteins where they arise will be eliminated by natural selection. Second, the USS that function well in DNA uptake are preferentially replacing sequences that function less well.
 We already know that USS in coding regions are preferentially found in particular reading frames. The figure to the left shows the number of perfect USS cores in each of the 6 possible reading frames of their proteins, and also shows the amino acids the USS would specify in each reading frame (source Karlin et al. 1996 NAR 24:4263-4272). You can see that most of the 395 'forward' USS are in reading frame 3, where the USS core specifies the tripeptide SAV (amino acids serine alanine valine). A similar fraction of the 571 'reverse' USSs are in reading frame -2, where their cores specify TAL (threonine alanine leucine). In both orientations the favoured frame specifies a central versatile amino acid flanked by one hydrophilic and one hydrophobic amino acid. Thus USS whose cores encode SAL and TAV have been suggested to be common because they are better tolerated than the others.
This analysis considered only perfect USS cores. Now I'm using the Gibbs sampler to get better datasets, and I want to find out whether being in coding regions affects the USS motif. I've finally managed to get the sampler to work on sets of genes, by splitting the gene sequence file into four short files it could handle and by specifying the expected motif structure with a strict 'prior' file.
The TIGR database provides links where I could download a file with all the coding sequences and a fine with all the non-coding sequences. Originally I thought I could only use these to get single motifs for (i) all the USS that code in the forward direction, (ii) all the USS that code in the reverse direction, and (iii) all the USS in non-coding parts of the genome. I know that it would be much more informative if I could sort out the sequences by reading frame (as in the drawing above), but I thought that would take some sophisticated bioinformatics skills.
But today I realized that it would actually be simple. The Gibbs output specifies, for each site that fits the motif, the position of its first base relative to the first base of the sequence. Because the first base is the start of the protein, I can find the reading frame simply by dividing the position number by 3. If the position of the first base of the motif is an even multiple of three (e.g. position = 93) then the motif is in frame 1. If it's not an even multiple but the remainder is 1, the motif is in frame 2. If the remainder is 2, the motif is in frame 3.
So all I need to do is paste the list of output sites into Excel (after some massaging in Word to get rid of excess spaces and separate the columns by tabs). Then I take the column of positions, use Excel's MOD function to get the remainder after division by 3, and SORT the sequences by the value in this column.
I had originally searched for USS coding in the reverse direction by searching the forward-coding sequences for the reverse motif. This isn't very satisfactory as it gives me a reverse-orientation motif, which is hard to compare with the forward one. But now I've found a web page that will take batches of sequences and convert them into their reverse complements (the sequence of the other strand), so I can analyze these for the forward motif. (Is your head spinning yet, dear reader?) Unfortunately it can only handle about 100 sequences at once, so I have to do the whole set (about 1730) in parts.
So that's what I'm about to do. I think I have all the Gibbs output files I need for this. The outputs aren't always centered on the same USS position so they're not all equally useful, but I think I have complete sets with the same center. And I have a few more queue'd up just in case.
One big issue arises because about 70% of the USS are in sequences that also code for proteins. So these sequences have two different evolutionary forces acting on them. First, they must continue to code for proteins that function well - any new USS that compromise the function of the part of the proteins where they arise will be eliminated by natural selection. Second, the USS that function well in DNA uptake are preferentially replacing sequences that function less well.
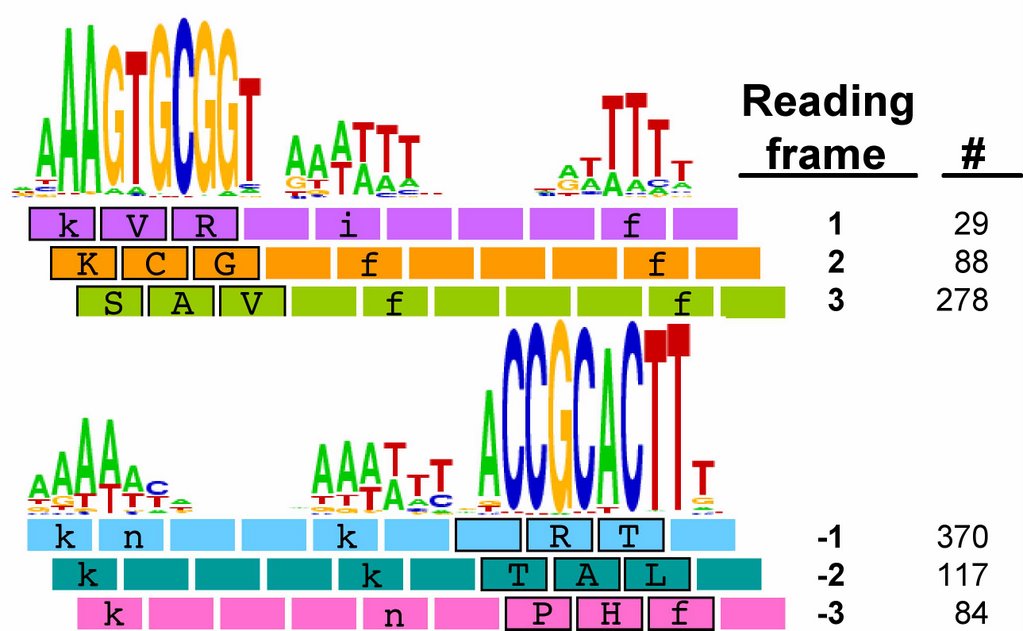 We already know that USS in coding regions are preferentially found in particular reading frames. The figure to the left shows the number of perfect USS cores in each of the 6 possible reading frames of their proteins, and also shows the amino acids the USS would specify in each reading frame (source Karlin et al. 1996 NAR 24:4263-4272). You can see that most of the 395 'forward' USS are in reading frame 3, where the USS core specifies the tripeptide SAV (amino acids serine alanine valine). A similar fraction of the 571 'reverse' USSs are in reading frame -2, where their cores specify TAL (threonine alanine leucine). In both orientations the favoured frame specifies a central versatile amino acid flanked by one hydrophilic and one hydrophobic amino acid. Thus USS whose cores encode SAL and TAV have been suggested to be common because they are better tolerated than the others.
This analysis considered only perfect USS cores. Now I'm using the Gibbs sampler to get better datasets, and I want to find out whether being in coding regions affects the USS motif. I've finally managed to get the sampler to work on sets of genes, by splitting the gene sequence file into four short files it could handle and by specifying the expected motif structure with a strict 'prior' file.
The TIGR database provides links where I could download a file with all the coding sequences and a fine with all the non-coding sequences. Originally I thought I could only use these to get single motifs for (i) all the USS that code in the forward direction, (ii) all the USS that code in the reverse direction, and (iii) all the USS in non-coding parts of the genome. I know that it would be much more informative if I could sort out the sequences by reading frame (as in the drawing above), but I thought that would take some sophisticated bioinformatics skills.
But today I realized that it would actually be simple. The Gibbs output specifies, for each site that fits the motif, the position of its first base relative to the first base of the sequence. Because the first base is the start of the protein, I can find the reading frame simply by dividing the position number by 3. If the position of the first base of the motif is an even multiple of three (e.g. position = 93) then the motif is in frame 1. If it's not an even multiple but the remainder is 1, the motif is in frame 2. If the remainder is 2, the motif is in frame 3.
So all I need to do is paste the list of output sites into Excel (after some massaging in Word to get rid of excess spaces and separate the columns by tabs). Then I take the column of positions, use Excel's MOD function to get the remainder after division by 3, and SORT the sequences by the value in this column.
I had originally searched for USS coding in the reverse direction by searching the forward-coding sequences for the reverse motif. This isn't very satisfactory as it gives me a reverse-orientation motif, which is hard to compare with the forward one. But now I've found a web page that will take batches of sequences and convert them into their reverse complements (the sequence of the other strand), so I can analyze these for the forward motif. (Is your head spinning yet, dear reader?) Unfortunately it can only handle about 100 sequences at once, so I have to do the whole set (about 1730) in parts.
So that's what I'm about to do. I think I have all the Gibbs output files I need for this. The outputs aren't always centered on the same USS position so they're not all equally useful, but I think I have complete sets with the same center. And I have a few more queue'd up just in case.
I've spent so much time fiddling with the MatrixPlot settings to get the best visualization of the correlation analysis that Matrix Plot won't let me submit any more jobs. (Who knew the site had a limit of 50 jobs per 24 hr period?)
I've done the final analysis with a set of 3466 sequences, each 39bp) and each containing at least a rough match to the USS motif. These were obtained by motif searches told that 3000 sites were expect on each strand; 1650 and 1816 were found. 1454 of these contain perfect matches to the 9bp core consensus, 512 have one-off matches, 557 have two-off matches, and 943 have core sequences that match the consensus at no more than 6 places. I think having this many mismatched sequences gives the analysis the power to detect correlations even between the highly-conserved core positions.
First, look at the control figure to the left. This shows analysis of 3500 random sequences, each 39bp long, taken from random segments of both strands of the H. influenzae genome. The bar charts at the top and left can be ignored - they show the 'information' at each position, but the scale for these bars only goes from 0.0 to 0.00 (weird, I know. I guess '0.0' represents zero, and '0.00' represents less than 0.01),
It's a bit surprising (to me) that the few scores higher than 0.002 are mostly found between positions separated by 3 (positions 1 and 4, positions 3 and 6, positions 4 and 7, positions 9 and 12, etc.). I suspect this has something to do with the way coding for proteins constrains the genome, but it's not something I'm going to follow up.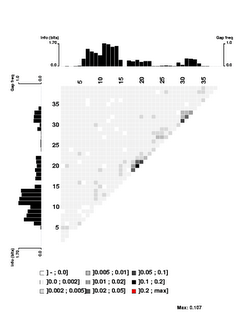
Here's the 'experimental' image. It shows significant correlations only between close-neighbour positions, and only between neighbours within each of the two flanking conserved AT segments. I suspect that even these 'significant' correlations are quite weak (the highest correlation score is only 0.107), but I don't understand the analysis well enough to be sure. The documentation is very brief; I may need to send someone an email asking for clarification.
(Here's a logo as a reminder of the motif.)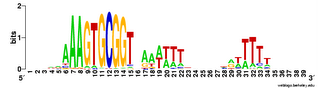
I've done the final analysis with a set of 3466 sequences, each 39bp) and each containing at least a rough match to
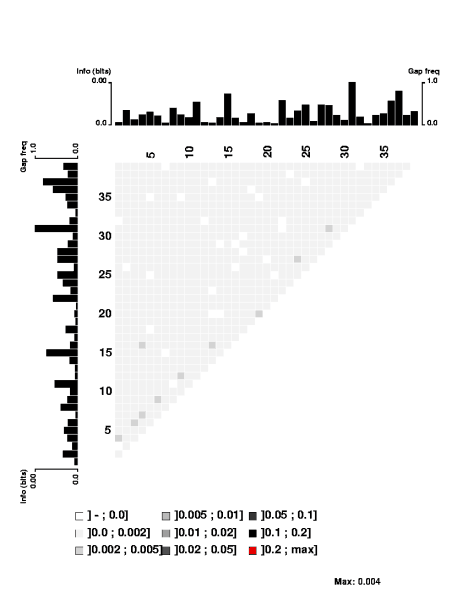 the USS motif. These were obtained by motif searches told that 3000 sites were expect on each strand; 1650 and 1816 were found. 1454 of these contain perfect matches to the 9bp core consensus, 512 have one-off matches, 557 have two-off matches, and 943 have core sequences that match the consensus at no more than 6 places. I think having this many mismatched sequences gives the analysis the power to detect correlations even between the highly-conserved core positions.
First, look at the control figure to the left. This shows analysis of 3500 random sequences, each 39bp long, taken from random segments of both strands of the H. influenzae genome. The bar charts at the top and left can be ignored - they show the 'information' at each position, but the scale for these bars only goes from 0.0 to 0.00 (weird, I know. I guess '0.0' represents zero, and '0.00' represents less than 0.01),
It's a bit surprising (to me) that the few scores higher than 0.002 are mostly found between positions separated by 3 (positions 1 and 4, positions 3 and 6, positions 4 and 7, positions 9 and 12, etc.). I suspect this has something to do with the way coding for proteins constrains the genome, but it's not something I'm going to follow up.

Here's the 'experimental' image. It shows significant correlations only between close-neighbour positions, and only between neighbours within each of the two flanking conserved AT segments. I suspect that even these 'significant' correlations are quite weak (the highest correlation score is only 0.107), but I don't understand the analysis well enough to be sure. The documentation is very brief; I may need to send someone an email asking for clarification.
(Here's a logo as a reminder of the motif.)

Gibbs motif search progress continues unabated
The sxy manuscript has been on hold, partly because one of the two grad students involved in it was in the far north. But he's back, and the manuscript is close enough to being finished that I'm hopeful it will be done soon ('soon' being an elastic term here). So I need to switch my attention to it and away from the motif searches for the USS-defined manuscript that have been consuming my brain power lately.
But before I stop I'm seeing how much I can get finished. I ran and analyzed the leading-strand and lagging-strand searches - their motifs are indeed identical to the composite one I posted.
The more-stringent and less-stringent searches gave the results I expected (fewer and more sites with the motif, with stronger and poorer mean scores, respectively). I used the run that gave the most sites and the worst mean scores to do a correlation analysis. (Having more sites that are imperfectly matched to the consensus increases the power of this analysis to detect weak interactions.)
The goal of the correlation analysis is to find out whether the bases at different positions of the USS interact. For example, the most common bases at position 17 are A and G, and the most common bases at position 21 are T and A. If we find that the individual USSs that have A at position 17 usually have T at position 21, and those that have G at position 17 usually have A at position 21, we would conclude that the bases at these positions interact during DNA uptake. Said another way, we'd conclude that USSs with a G at position 17 function better if they have a A at position 21.
Results: MatrixPlot found only weak correlations between only a few adjacent positions in two clusters. A colleague has kindly used software he wrote to also analyze a preliminary data set for us; I'm going to ask him if he can test the big set. Before doing this, I realized that I only have half the data, as I only did the low stringency searches on the forward strand. So I've queue'd up more searches, with the same and even lower stringency, on both forward and reverse-complement strands.
And, finally, some of the gene searches are working, thanks to fine-tuning advice from the helpful Gibbs expert. These runs are searching the sequences of only the parts of the genome that code for proteins, to see if the direction of coding affects the motif. I had to split the gene set into four parts, and two of these managed to find their motifs. So I've queue'd up more replicates, using more seeds, and also runs looking for the reverse-strand motif.
And last night I read over the Introduction and improved parts of it, though it still needs more work.
Progress continues
The computer cluster guys were great. They took extra pains to make sure we understood the big issues, they were really helpful in suggesting ways to optimize our runs, and they even gave us a tour of the WestGrid system.
 I've cataloged the reverse-complement runs (same basic results as the forward runs), and made this composite logo based on all the USSs in the genome (i.e. both strands). It doesn't look any different than a composite logo I posted about 6 weeks ago; the difference here is that now I know I've done the right analysis.
Now on to analyzing the leading-strand and lagging-strand searches. I already did a quick-and-dirty version of that too, but again now I'll have done it well.
Subscribe to:
Posts (Atom)