In between thinking about the
sxy manuscript (yes, it's getting closer to being done), I'm making progress on the motif analysis.
One big issue arises because about 70% of the USS are in sequences that also code for proteins. So these sequences have two different evolutionary forces acting on them. First, they must continue to code for proteins that function well - any new USS that compromise the function of the part of the proteins where they arise will be eliminated by natural selection. Second, the USS that function well in DNA uptake are preferentially replacing sequences that function less well.

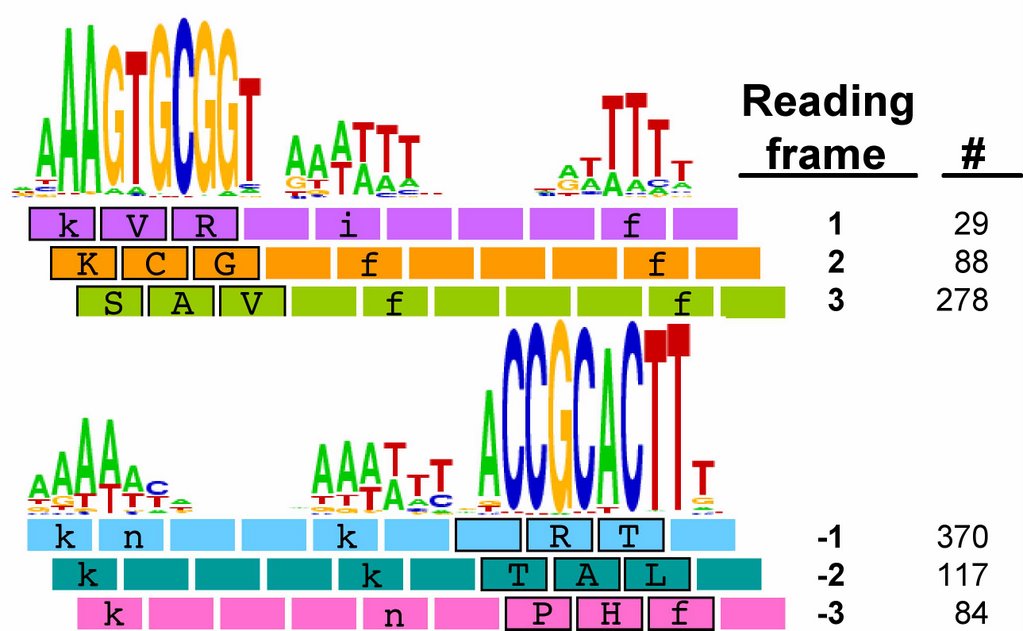
We already know that USS in coding regions are preferentially found in particular reading frames. The figure to the left shows the number of perfect USS cores in each of the 6 possible reading frames of their proteins, and also shows the amino acids the USS would specify in each reading frame (source
Karlin et al. 1996 NAR 24:4263-4272). You can see that most of the 395 'forward' USS are in reading frame 3, where the USS core specifies the tripeptide SAV (amino acids serine alanine valine). A similar fraction of the 571 'reverse' USSs are in reading frame -2, where their cores specify TAL (threonine alanine leucine). In both orientations the favoured frame specifies a central versatile amino acid flanked by one hydrophilic and one hydrophobic amino acid. Thus USS whose cores encode SAL and TAV have been suggested to be common because they are better tolerated than the others.
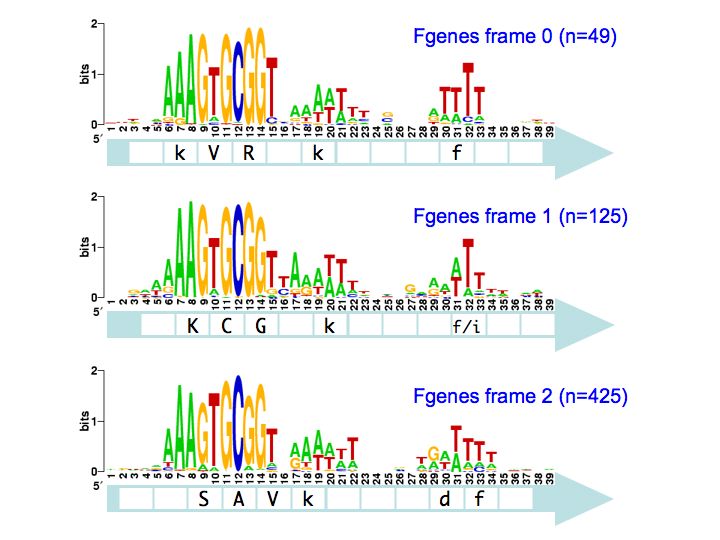
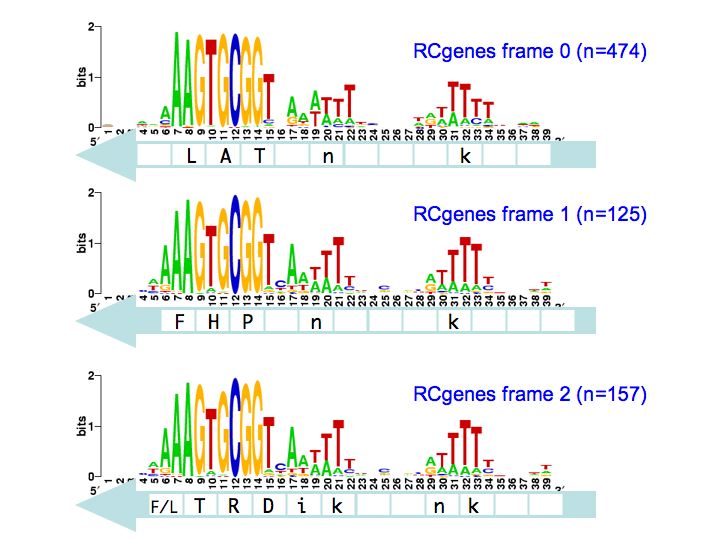
This analysis considered only perfect USS cores. Now I'm using the Gibbs sampler to get better datasets, and I want to find out whether being in coding regions affects the USS motif. I've finally managed to get the sampler to work on sets of genes, by splitting the gene sequence file into four short files it could handle and by specifying the expected motif structure with a strict 'prior' file.
The
TIGR database provides links where I could download a file with all the coding sequences and a fine with all the non-coding sequences. Originally I thought I could only use these to get single motifs for (i) all the USS that code in the forward direction, (ii) all the USS that code in the reverse direction, and (iii) all the USS in non-coding parts of the genome. I know that it would be much more informative if I could sort out the sequences by reading frame (as in the drawing above), but I thought that would take some sophisticated bioinformatics skills.
But today I realized that it would actually be simple. The Gibbs output specifies, for each site that fits the motif, the position of its first base relative to the first base of the sequence. Because the first base is the start of the protein, I can find the reading frame simply by dividing the position number by 3. If the position of the first base of the motif is an even multiple of three (e.g. position = 93) then the motif is in frame 1. If it's not an even multiple but the remainder is 1, the motif is in frame 2. If the remainder is 2, the motif is in frame 3.
So all I need to do is paste the list of output sites into Excel (after some massaging in Word to get rid of excess spaces and separate the columns by tabs). Then I take the column of positions, use Excel's MOD function to get the remainder after division by 3, and SORT the sequences by the value in this column.
I had originally searched for USS coding in the reverse direction by searching the forward-coding sequences for the reverse motif. This isn't very satisfactory as it gives me a reverse-orientation motif, which is hard to compare with the forward one. But now I've found a
web page that will take batches of sequences and convert them into their reverse complements (the sequence of the other strand), so I can analyze these for the forward motif. (Is your head spinning yet, dear reader?) Unfortunately it can only handle about 100 sequences at once, so I have to do the whole set (about 1730) in parts.
So that's what I'm about to do. I think I have all the Gibbs output files I need for this. The outputs aren't always centered on the same USS position so they're not all equally useful, but I think I have complete sets with the same center. And I have a few more queue'd up just in case.