Field of Science

Not as random as it should be

On Saturday I described a key step in the motif-search computer program thusly ("thusly"? Pomposity alert!):
The program uses a random-number 'seed' to start searching the genome sequence for sequences whose consensus motif fits this pattern. ... Once the score is stable for a 'plateau' number of cycles the search ends and the program stores the final set of sequences that gave this pattern and goes on to try another random number seed.
Well. the seeds are supposed to be random numbers. The program uses them to get approximately random starting patterns, from some of which it converge on very similar final motif patterns. In any one run only a few of any 100 seeds lead to any approximation of the USS pattern, with the rest stuck muddling around in poorly-matched pseudo-patterns. But of course starting with identical seeds will give identical outcomes

This morning I noticed that two replicate runs that had been put into the computer queue within a few seconds of each other had given exactly the same results for all 100 seeds they claimed to have used. The program doesn't report each of the seeds used, but it does give you the initial seed it started the whole run with. Surprise surprise, the identical runs had started with identical 10-digit seeds (1162169861). And the next run queue's had the number 1162169821, differing only in its second-last digit. And the next two runs also had identical seeds (1162169911) Not only are these numbers much too similar to be considered 'random' the identity of all the results implies that each of the other 99 seeds is completely determined by the first seed.

I had assumed that any respectable computer program would draw whatever random numbers it needed from the random-number generator that's built in to most programming language compilers. (That's what our Perl programs do.) These actually generate pseudo-random numbers, and a great deal of analysis has gone into designing and evaluating the algorithms they use (they're also used in computer-security applications).

But I was wrong. I just went back to the original program notes, and found that one of the many settings users can specify is a 'random number generator seed'. This feature isn't discussed anywhere in the notes, and none of the examples provided in the notes use it. But maybe it prevents exactly the problem I'm having.

I've sent an email to my helpful advisor, and in the meantime I've queue'd up substitute runs, spaced far enough apart in time that they should have distinct seeds.

How random is it?

My first Gibbs sampler run was 'out of time' at 12hr, but the next one finished in 17hr. I used its output to evaluate whether reducing the stringency of the plateau period would reduce the quality of the analysis. The result: future runs will be about 40% faster because they'll use a plateau of 100 cycles rather than one of 200 cycles. I already have some whole-genome results using 100 seeds and 100 cycles, so I've queue'd up enough more to give me four with the forward-direction genome sequence and four with the reverse-complement sequence. These should provide enough data for all the whole-genome analyses.

I now realize there's another analysis I should try to do - testing the randomness of the positions of USSs around the genome. This is an interesting feature because USS spacing should reflect the forces that maintain all these USSs in the genome.

USS spacing was first addressed in the first genome USS analysis (Smith et al 1995), but they only said it was 'essentially random'. The human eye is notoriously bad at detecting randomness, so Karlin et al. took a much more rigorous approach (Karlin is a famous Stanford mathematician), calculating something called the r-scan statistic, which he developed and which looks too hard for me to follow. Karlin et al concluded that USS spacings were more even than expected for a randomly-located sequence element. This non-randomness led the authors to suggest that USSs might
contribute to global genomic activities such as replication and repair (the DNA repair hypothesis), sites of membrane attachments in association with domain loops, sites of nucleating Okazaki fragments or helix unwinding and/or sites contribution to genome packaging. (Yes, the syntax seems a bit off to me too.)
I think these suggestions are wrong, for reasons I'll go into another time, but the lack of randomness may still be telling us something important about the forces that maintain USS.

Karlin et al.'s analysis used only the positions of perfect USS cores (AAGTGCGGT and reverse complement). I think I should now repeat it on my new unbiased USS data. Well, really what I mean is that I think I should either find a tame mathematician/statistician who can show me how to do it, or find a similar analysis that's easier for me to understand. (Hmmm, I think my neighbour at a lunch on Thursday was a bioinformatics statistician - maybe she can give me some advice.)

Deciding how much (computer) data is enough

I need to decide how many replicates of the motif sampler analysis I should do for our 'defining the USS' paper. And at what level of stringency to do each replicate. For real experiments, such decisions are made by factoring in how much work each experiment will be, and how expensive the needed resources will be. But the computer cluster we're using is free to us, and starting a run takes very little of my time. (It's deciding what to do that takes the time.)

I'm starting with the first analysis: searching the whole genome sequence for sites fitting the USS pattern whose spacing is specified by my 'fragmentation mask' prior (a 10bp motif followed by two 6bp motifs separated by 1 and 6 bp. The prior file uses this line:
++++++++++x++++++-xxxx-++++++
where ‘+’s specify positions whose consensus is to be included in the motif, and ‘x’ and ‘-’ positions that are not to be included and that are optional, respectively.

The program uses a random-number 'seed' to start searching the genome sequence for sequences whose consensus motif fits this pattern. Initially it finds only sequences whose consensus motifs very weakly match this pattern, but it goes through many cycles trying to improve the motif its found to get a better match.

It scores the quality of the matches with a MAP number. The first cycles always give MAP scores much less than zero (-4000 is typical); scores improve in later cycles cycles. Once the score is stable for a 'plateau' number of cycles the search ends and the program stores the final set of sequences that gave this pattern and goes on to try another random number seed.

With genome-sized sequences, most of the time the score never gets much better than -4000 because the search hasn't found the real USS motif. But sometimes it gets lucky and finds the motif, and then the scores on successive cycles rapidly increase to values around +4000. Once the program has completed trying the specified number of seeds, it checks the results from all the seeds to find the one that gave the best MAP score. It then polishes this set of sequences to see if it can get an even better score, and then reports this as the final set of sequences and consensus.

So I control stringency by specifying two things. First, I specify how long the 'plateau period should be (how long the program keeps trying to see if it can find a better motif). Second, I specify how how many different random number seeds the program tries before it picks the best results for polishing.

The default is a plateau of 20 cycles and 10 seeds. But I've been advised to use a plateau of 100 or 200, and lots more seeds. One complication with running analyses on the computer cluster is that you have to specify in advance how much time your run will need (the cluster uses this info to set your place in the queue). I don't have a good idea how long my runs will take on this cluster, so I submitted a test run using plateau = 200 and seeds = 100. I set the time limit to 12hr because a much shorter run had taken only 2 minutes, but it's been going for 7.5 hours now.... If it runs out of time before it's done I suspect that I won't get any interim results, just a blank file. So a few hours later I queue'd up an identical run with a 48hr time limit. I hope that's long enough.

On Wednesday one of the post-docs and I are meeting with the local experts for this computer cluster. We sent them an email confessing that we don't really know what we're doing, and I suspect they feel they'd better straighten us out before we seriously mess up their system.

Perl make-believe vs reality

The computer cluster did finish my job, and I solved an email-notification problem the job had. But in this post I'm going to write about progress with another project, our Perl computer-simulation model of USS evolution.

One of the post-docs and I have been polishing up the Perl simulation, writing a 'narrative' that attempts to explain in plain English what the Perl program does. This is a necessary step to make sure we understand the program correctly before she does a big batch of runs to characterize the equilibria. Now we're asking the other post-doc to help us improve the narrative, so it's sufficiently clear that it makes sense to someone not familiar with the Perl code.

In the course of writing the narrative, we realized that neither of us has a clear understanding of how the steps in the program might correspond to the biological reality we're trying to simulate. Our confusion is not so much about how USS might have been accumulating in the genome over evolutionary time, as about how the events in each cycle of the simulation might correspond to the molecular events of DNA uptake and transformation. So we decided that I should try to explain this in my next lab meeting, which is on Tuesday.

I just made a first pass at explaining it to both postdocs, scribbling all over two of the big whiteboards in the hall. I'm very happy with the result, as we generated the following very clear and accurate statement of what the USS-conversion probabilities in the model really represent. Here it is:
The probability P2 represents, for each USS in the genome (perfect, on-off or two-off USS), the probability that the cell has taken up and recombined a homologous DNA fragment containing a perfect version of this USS. Probability P3 represents the same probability for taking up and recombining a homologous fragment containing a one-off version.

waiting...

Hmm, I'm still 53rd in the computer-cluster queue. Time to consult with the post-doc.

Oh no, will I have to learn something new?

I've just received a polite email from the manager of the computer cluster I'm using, asking that I learn to run my jobs properly (by submitting them to the queue) rather than just running them from the terminal. The only reason I haven't been doing the right thing is that I don't know how.

So he pointed me to a web page with instructions, which were rather opaque to me because I don't really speak Unix. So then I asked the post-doc who's been doing this with her Perl program, and she pointed me to a set of instructions I'd scribbled down about 18 months ago, when I first learned about this computer cluster from a whiz-bang grad student in another lab.

So I've more-or-less blindly followed these instructions, and submitted my first job to the queue. I know I did that part correctly because I can ask the terminal to show me the queue and my job is indeed in it, along with about a zillion other jobs. Mine is 53rd, so there are a zillion-53 jobs after mine. There are also about half a zillion jobs already running, so maybe being 53rd is pretty good. Some of the jobs that are running aren't predicted to finish for more than a week.... (You can probably tell that I'm out of my depth here.)

The really annoying thing is that I don't get any feedback until my job is done, when I'll get an email. Guess I'd better learn how to work this system.

Turning the Perl program into a story

I started writing the Perl computer program nearly two years ago. I worked on it intermittently for most of a year, got it doing most of what I wanted, and then set it aside in the press of other things that seemed more urgent. This past summer one of the post-docs took it on - she wanted to learn Perl and bringing this model to fruition (= we publish a paper about the results) seemed like a great way to learn.

SO far so good. She's embellished the program and debugged it and now it seems to be doing just what we want. The most important words there are 'seems to' , because right now neither of us is confident that we really understand how the program does things, which means we can't be sure it's doing them right. I wrote the basic modules (procedures? subroutines?) of the program, but I forget how they work. And the post-doc has been able to use them without having to dig into how they work.

So now we're creating a narrative of the program, in which we try to explain in ordinary English all the things the program is doing, and how it decides what to do. A computer simulation is like a game of "let's pretend": let's pretend that these are the rules you must act by, and these are the conditions you start with. At certain points decisions need to be made, and the program spells out the rules for making each decision. At many points in our program the decision involves getting a random number (the computer equivalent of rolling the dice), but even here there are precise rules.

What we're trying to do now is write out a clear accurate description of what happens at each step. Of course such a description already exists in the program itself, but by recreating it in plain English we're forcing ourselves to make sure we really understand it. In effect we're making ourselves explain it to each other - in my experience that's the best way to be sure you understand anything you want to get right.

We hope this will only take another day or so, and then we can confidently put the program to work generating DATA!

A provocative sxy result?

Provocative in the sense that it may require that we do something.

A few days ago, in sxy continued I wrote
8. The sxy-6 mutant isn't just not hypercompetent, it's much less competent than wildtype cells (10-fold to 500-fold, depending on the assay conditions), even though it is predicted to have the same number of base pairs when folded. This was especially surprising because its mutations replace a strong G:C basepair with a weaker A:T basepair. This may be telling us that in wildtype mRNA the G and C bases interact with bases at other positions as well as with each other, and that these unknown interactions enhance expression of sxy.
Now one of the lab people has checked the amount of Sxy protein in this mutant, and found that in rich medium there is a little more than wildtype, as we would have originally expected, not less than wildtype as predicted by its less-than-wildtype transformation frequency.

One possible explanation for the discrepancy between Sxy protein and transformation frequency is that the sxy-6 mutant could have some other genetic change that we're not aware of, that reduces its ability to take up DNA. We can test this by resequencing its sxy gene to check if other mutations are present, and by doing either of two genetic tests. First, we could use transformation to move its sxy gene into a 'clean' genetic background and see if the transformation frequency stays the same. Second, we could move a wildtype sxy gene into it (again by transformation) and see if its transformation frequency becomes wildtype. Either test may be a pain to do because we can't directly select for the desired recombinants, but have to rely on selecting for a linked antibiotic resistance and then checking the genotype by sequencing.

So before doing any of these I'll carefully recheck the PhD thesis of the student who originally made the mutant and studied its properties. If she made and tested a lacZ fusion of this mutant, her results may clarify things.

Progress on the sxy manuscript

I've been working on the sxy manuscript, clarifying/rewriting the text and improving the figures. I'm not yet all the way through the Results but it's looking a lot better.

The Introduction wasn't too bad anyway, but now it flows better and explains the issues in a more logical order. It's also 65 words shorter, mostly because I cut out some repetition and tightened the sentences.

The Results section is a lot better now. I polished Figure 2, which shows the structure of the sxy gene's 5' end, and now point out that this untranslated region is unusually long. The correlation between Sxy protein and competence is stated rather than just being implied, and backed up with Figure 4. We have a beautiful new version of Figure 5, with all the bands clearly visible, but the text describing these results still needs work. The description of the compensatory mutation work is clearer.

I came up with a 'spin' that turns a discrepancy into a result: RNase analysis shows little difference between mutant and wild-type sxy structures, but the phenotypes are very different. I now say this means that the structure is stable in vitro but labile in vivo, probably due to dynamic effects while the mRNA is being synthesized.

My explanation of the fusions of sxy to lacZ are now much clearer, mainly because my many attempts to really understand this data finally paid off. I've inverted the order in which we discuss the normal (long) and stem-free (short) fusions. The short ones were created as a bit of an afterthought (no, that's probably unfair to the grad student who did this - these fusions we something she thought up herself, and I don't know when). Anyway, I realized that we should consider them first, and then contrast them with the fusions that have the normal structure. I think it's much easier to think about this way. And my new clarity also produced a newly-clear figure, with simple schematic drawings of the fusion structures.

And then my brain shut down for the day.

Details of RNA folding predictions


I've been checking the predictions that the RNA-folding program mfold makes about our sxy mRNAs, this time using a feature that colours each position according to how 'well-determined' its pairing assignment is, as shown in the first figure. Here for example the unpaired nucleotide at position 20 is coloured red, meaning that Mfold is quite confident that it is unpaired (a "P-num" score of 0 or 1). Similarly, the paired nucleotide at position 21 is also coloured red to indicate that Mfold is quite confident that it is paired. Many of the nucleotides in stem 3 (positions 61-91) are coloured blue or black, to indicate less confidence (P-num scores of 2 and 3 respectively).

It's important to remember that the colour doesn't indicate how strong the pairing is, but how good the evidence is (either for or against pairing).

The second folded molecule is the mutant sxy-1 RNA. The little one-base bubble at the bottom of stem 1 is caused by the mutation. More notable is that most of the nucleotides in stem 1 are now coloured blue rather than red. This means that changing one base from a G to an A has decreased Mfold's confidence in all the base paired positions in the stem. This is consistent with what our RNase digestions show - the one-base sxy-1 change decreases the proportion of molecules that are base paired at all the positions in stem 1, not just at the site of the mutation.

Sxy continued

7. The reduced competence caused by the compensatory mutations in the sxy-6 strain proves that the
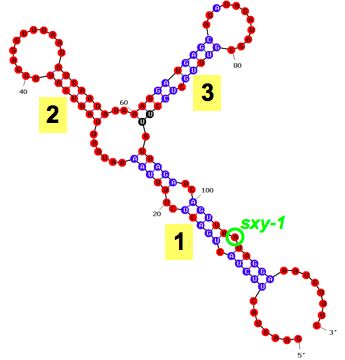
 sxy-1 and sxy-3 mutations cause hypercompetence by decreasing the number of base pairs in folded sxy mRNA. To confirm the effect, and to see how strongly the folding can inhibit sxy expression, we made a mutant with two extra base pairs (sxy-7). As predicted, it is even less competent - in fact it can't be transformed at all (Fig. 6A).

8. The sxy-6 mutant isn't just not hypercompetent, it's much less competent than wildtype cells (10-fold to 500-fold, depending on the assay conditions), even though it is predicted to have the same number of base pairs when folded. This was especially surprising because its mutations replace a strong G:C basepair with a weaker A:T basepair. This may be telling us that in wildtype mRNA the G and C bases interact with bases at other positions as well as with each other, and that these unknown interactions enhance expression of sxy.

9. We also directly checked the amounts of Sxy protein in the sxy-6 and sxy-7 mutants; it's much less than in the parent mutants and in wildtype cells (Fig. 6B). I don't have the draft version of Fig. 6B yet, although the data has been collected.

10. We don't know how the mRNA base pairing prevents sxy expression, although we are considering several possibilities, all involving effects either on the amount of sxy mRNA in the cell, or on the ability of the mRNA to be translated into protein. To distinguish between these, we examined the amounts of sxy mRNA in wildtype and mutant cells under various culture conditions. If folding reduces Sxy protein by reducing the amount of mRNA, then the mutant cells should have amounts of sxy mRNA proportional to their amounts of Sxy protein. If folding acts only by preventing translation, then the mutants should all have the same amount of sxy mRNA as wildtype cells.

The results are intermediate. The mutants contain less sxy mRNA than the wildtype cells, but they contain more mRNA than we would expect from their reduction in Sxy protein (Fig. 7; I don't have all of the final data for this figure). This means that the folding must limit both the amount of sxy mRNA and its ability to be translated into protein.

11. This conclusion is supported by data from gene fusions that put the E. coli lacZ gene under control of sxy mRNA. One kind of fusion ("operon fusion") tells us about effects of sxy amount and on folding on mRNA amount; the other ("protein fusion") tells us about the combined effects on mRNAmRNA translatability. [I hope I've got this right - I find it very hard to keep these effects straight.] We (i.e. a former PhD student) constructed two pairs of fusions. In one pair, both fusions (protein and operon) join lacZ gene (to a downstream position in the wildtype sxycodon 89), meaning that in both the mRNA can fold normally. In the other pair, both fusions join lacZ to a position further upstream (codon 11) in the mRNA, bypassing a part of the mRNA essential for folding (so these fusion RNAs should have no folding).
Caveat: I don't know whether we've checked the predicted folding of the codon 11 fusion mRNAs. It will lack the base pairings involved in the mutations we've studied (the main stem), but could still have the other 'internal' base pairs that we think might block access to the translation start site.
After much tearing of hair and drawing on the whiteboard, I think it's clearest to consider the no-folding fusions first, and then examine how folding changes lacZ expression (measured as beta-galactosidase activity). The no-folding protein fusion produces 2.8 times as much beta-galactosidase as the no-folding operon fusion. We expect both to have the same amount of mRNA, so this means that the sxy translational signals (ribosome-binding site and start codon) work 2.8 times better than the lacZones. That's neither surprising nor interesting in this context. The folding operon fusion produces only 0.45 as much activity as the corresponding no-folding fusion, telling us that folding reduces the amount of mRNA to 0.45. The folding protein fusion produces only 0.20 as much activity as the comparable no-folding fusion. We expect the folding fusion to have produced 0.45 as much mRNA, so the folded mRNA must be translated only 0.44 as well as the no-folding mRNA (Fig. 8).

It will be nice if the direct measurements of mRNA and Sxy protein (by real-time PCR and immunoblot respectively; Fig. 7) give the same magnitude of effects as the fusions. The preliminary data for Fig. 7 suggests a stronger effect of translatability than the fusions suggest.

13. Work by another group about 10 years ago had suggested that sxy transcription is stimulated by cAMP, and they reported that the sxy promoter contained a CRP binding site responsible for this effect. We find that adding cAMP reduces expression of the sxy operon fusion. This is consistent with the location of a CRP site in a position where it will block transcription rather than stimulating it. I don't think this result deserves a figure (maybe because we don't have pretty data).

14. We did some microarray analysis of expression of all genes in the sxy-1 hypercompetent mutant, under conditions that don't induce competence in wildtype cells. We can mention that all the competence regulon (CRP-S regulon) genes were being overexpressed. We won't show the data as we haven't done lots of microarray replicates (maybe we only did one). This should probably be described briefly under point 2 in the previous post.

15. We have examined the predicted foldings of sxy mRNAs from related species in the family Pasteurellaceae. None of them were predicted to fold like H. influenzae sxy. This could just be mentioned in the Discussion.

Everything you always wanted to know about Sxy but were afraid to ask

(Sorry about the title - I'm going to post only a fraction of what we know, only what will be in our Sxy paper, but I couldn't resist. And no, I'm not a big Woody Allen fan.)

You can find some Sxy background in this post.

I'm basically going to describe what's in our figures and what they tell us. But no, I'm not going to post the figures themselves; I fear this would be perilously close to the kind of "prior publication" that journal editors forbid.

1. We have 4 more sxy mutations that cause hypercompetence (5 mutations in all). They all increase competence at least 100-fold in non-inducing conditions, and about 20-50-fold in partially inducing conditions (Fig. 1).

2. Each of these mutations changes 1 base pair of sxy DNA, but 4 of them don't change the Sxy protein at all (Fig. 2). So we suspected that they cause hypercompetence by increasing the amount of Sxy protein in the cell, not by changing what Sxy protein can do.

3. Each mutant strain does have more Sxy protein (between 3-fold and 50-fold more, depending on the mutation and the growth conditions) (Fig. 3A). The competence of each strain (measured as transformation frequency) increases with the amount of Sxy protein in the cells (Fig. 3B). How could the mutations cause this? We propose that they cause this by interfering with how part of the sxy mRNA folds back on itself. The folding lets the two different parts of the mRNA where the mutations occur form base pairs with each other (Fig. 4).

4. We show that sxy mRNA does fold by examining the digestion of pure sxy mRNA with RNase enzymes (Fig. 5). This confirms that, in wildtype sxy mRNA, the nucleotides where the mutations occur are involved in base pairing, as are many other nucleotides in the 'internal' part of the mRNA between the mutation locations. Almost all of the base pairing is consistent with a complicated folded structure predicted by a computer program called Mfold (part of Fig. 5).
Problem with the data for Figure 5: The gel images are not reproducing well - either everything is washed out or it's too dark. This isn't just a problem with the printer resolution, as the screen image has it too. I hope this can be corrected using the imaging software that created the gel image (I hope we don't need to run a new gel).
5. RNase analysis of mRNA with the sxy-1 mutation shows almost the same structure. We predicted that the sxy-1 mutation weakens the folded structure because it decreases by 1 the number of base pairs holding it together. We see this only as a modest increase in the RNase digestion of all the nucleotides in the paired region affected by the mutations (another part of Fig. 5).

6. The best test of our hypothesis that the mutations cause their effects by preventing base pairing is to restore base pairing while keeping the mutations. We can do that easily because two of our mutations, when combined in the same chromosome, can base pair with each other, giving a 'double mutant' that has both mutations but the normal number of base pairs. If we're right, this double mutant will not be hypercompetent. And it's not (Fig. 6A).

To be continued....

Where was I?

A brief (I hope) loss of focus.... Now what were the main things I'm working on?

The CRP-S manuscript and the USS-2006 manuscript have both been officially accepted and proof-read. All that's left to do is pay the enormous open-access publication charges. As soon as we have the final formatted PDFs I'll replace the manuscript pdfs in the sidebar.

The sxy manuscript: Analysis of 5 hypercompetent mutants, effect of compensatory mutations, structure predicted by Mfold and confirmed by RNase mapping, effects on transcription and translation measured by lacZ fusions, real-time PCR and protein immunoblots. These experiments are all done, but the manuscript writing has stalled.

The USS-definition analysis/experiments/manuscript: 1. Characterization of genomic USS ("USS-G") by Gibbs motif searching, including effect of direction of DNA replication and of protein coding (and maybe reading frame): These experiments are partly done. 2. Re-analysis of published sequences of DNA fragments that are preferentially taken up: This is mostly not done yet. 3. Uptake experiments using DNA fragments with specific differences in USS sequence: This is mostly done. 4. Writing the manuscript: This morning the post-doc and I will sit down together to reconcile the three different versions of the Introduction. Some of it we'll move to the Discussion. The Results section is mostly not written yet - starting this will clarify what results still need to be generated. Much of the Methods is already written.

The Perl simulation: The post-doc is away for a week, leaving a simulation running on Stingray, our fast new Mac (all our computers are named for Australian animals). It's still not at equilibrium after almost a week, and the simulated sequence has accumulated a lot of USSs. The plan is to explore a range of parameter values (mutation rate, uptake bias) and then introduce some more complications (hmmm, what were they???).

The grant proposal: Create an 11-page compelling description of our past and future research. Still a long way to go, especially on the "compelling" part.

Heresy about Ethidium Bromide

Recently I've received several copies of an email warning of the dangers of ethidium bromide (a chemical used to visualize DNA in agarose gels) and advertising a seminar about a safer alternative. The email originated from Invitrogen, the company that sells the alternative DNA stain ("SYBR safe"*) and is sponsoring the seminar. Here's the first two paragraphs of the email:
A real risk of lab science is accidental exposure to hazardous chemicals, especially ones that may be fatal if inhaled, harmful if swallowed or absorbed through skin, causing irritation to skin, eyes and the respiratory tract and causing heritable damage.

Ethidium bromide has just such characteristics and is frequently in use at many UBC labs. A safer alternative is available that is non-toxic, non-mutagenic and is not classified as cytotoxic waste when disposed. To alert the UBC res
earch community to this safer alternative called SYBRSafe Gel Stain, the Department of Health Safety and Environment and the UBC Sustainability Office are sponsoring a seminar presentation by Invitrogen on the product comparison and practical application of SYBRSafe.
This would be fine if ethidium bromide (EthBR) really was a serious hazard. But it's not. And it's actually less toxic than this alternative.

Ethidium (also called homidium) was developed as a treatment for trypanosomiasis (African sleeping sickness), and is still used in Africa where resistance to it is not a problem. The following quote is taken from the Encyclopedic Reference of Parasitology (2004): "...homidium is generally well tolerated at recommended dose and also at higher dose levels (no systemic toxicity)..." (source). The recommended dose for cattle is 1mg/kg body weight (up to 50mg/kg has been used in mice). Compare this with the 0.25 - 1 microgram/ml used in molecular biology (previous error corrected - thanks, anonymous commenter). A 50kg researcher would need to drink 50 liters of gel-staining solution to get even the non-toxic dose used in cattle.

Here's information from a materials safety data sheet (MSDS) provided by Fisher Scientific:
Ethidium Bromide: (inhalation, rat): 0.0118 - 0.1340 mg/L/6H. (oral,rat): 1503 mg/kg. sts determined to be toxic based on: LC50 (inhalation rat) 0.0472mg/L/1H * 100 (dilution rate)=approximately 4.72mg/L/1H.
Carcinogenicity:
CAS# 7732-18-5: Not listed by ACGIH, IARC, NTP, or CA Prop 65.
CAS# 1239-45-8: Not listed by ACGIH, IARC, NTP, or CA Prop 65.

Epidemiology: No information found
Teratogenicity: No information found
Reproductive Effects: No information found
Mutagenicity: Possible mutagenic effect in humans. The suspicion is based on proven damage to the genetic material in the somatic cells of man and animals and requires further clarification.
Neurotoxicity: No information found
Translating as best I can, half of mice given 1.5g /kg body weight will die, as will half of mice that spend 6 hours breathing air containing about 0.12mg EthBr dust/liter. There is no evidence of neurotoxicity or of birth defects or reduced fertility even at the high doses routinely used in cattle.

Despite the evidence, the "EthBR is very dangerous" meme has become dogma in molecular biology. This is because EthBR can increase the frequency of mutations, a topic on which most people are very irrational.

Ethidium is a flat molecule, just the right size to get in between the stacked base-pairs of double-stranded DNA. This, and its fluorescence, are what makes it a sensitive dye for detecting DNA. The presence of ethidium when DNA is being replicated can cause DNA polymerase to slip, creating short insertion or deletion mutations. Here's a 1999 reference. However there's no direct evidence that exposure to EthBr causes mutations, tumors or birth defects in any animal, and its routine use at high doses in cattle suggests that it doesn't.

Excessive concern about mutagenicity can make us overlook short-term toxic effects, and here EthBr is the safer dye. The reference above found that the SYBRsafe alternative was actually much more toxic than EthBr to the bacterial cells used in the mutagenicity tests. SYBRsafe was toxic at concentrations as low as 1 microgram/ml, whereas EthBr toxicity was not observed until 250micrograms/ml. The authors suggest that this is because living cells are much more permeable to SYBR green than to EthBr. But a MSDS for SYBR safe reports a LD50 for rats of >5g/kg, which is higher than that of EthBr (1.5g/kg). As both these LD50s are many orders of magnitude higher than the concentrations used in molecular biology, toxicity of gel staining solutions is trivial compared to the risks of of burns from melted agarose or slipping on spilled gel buffer.

Perhaps the largest real hazards associated with use of EthBr in molecular biology are the methods used to inactivate it. Some labs now incinerate all waste containing even a trace of EthBr, and others absorb it onto activated charcoal. Harsher methods involve use of bleach and sodium hydroxide, or hydrophosphorous acid and sodium nitrite, all much more dangerous than EthBr.

A final issue is cost, and here SYBR dyes may indeed be better, even though they cost a lot more per use than EthBr. This note compares the costs of different DNA stains used in agarose gels, and concludes that the new SYBR stains may save money because their greater sensitivity allows use of smaller amounts of the costly size standards. For example, this photo shows that SYBR gold can reveal bands containing as little as 100pg of DNA. (It also shows how big a problem fluorescent dust flecks can be when using SYBR stains.)

Despite the evidence of its safety, all the scientists I know continue to believe that EthBr is dangerous. It's not that we differ on how the evidence should be interpreted - they have never examined the evidence and see no point in doing so, even when I tell them that it contradicts their beliefs. I find this scary.

*I haven't been able to find out what SYBR safe is, nor the actual concentrations of the products on the market. It's all "proprietary information".

Take it to the limit (one more time)

The postdoc who's been working on the perl simulation of USS evolution now has everything working, including the equilibrium test that I said I would post about but didn't. I'll have to describe this test later (or maybe she will) because here I want to comment on a different issue.

One problem with simulating biological processes is that they need to be very unrealistic, otherwise they can't be made to work at all. One of the unrealistic features of our USS simulation is the need to use unrealistically high mutation rates, as much as a million times higher than real mutation rates. It's possible to simulate lower mutation rates, but each simulation would take years to run, rather than minutes or hours.

It's tempting to think that the most realistic simulations will be the most informative, but that's far from universally true. In most models the effects of changing variables, and the interactions between variables, are at least as important as the absolute values of the variables. In our USS model, we want to understand how changing each of the following affects the equilibrium numbers of perfect and imperfect USS sequences:
  1. the mutation rate;
  2. the strength of the uptake bias;
  3. the ratio of mutation rate to uptake bias.
The most realistic simulations would use very low mutation rates, and they'd take a lllooonnngg time to run. But we may be able to identify the patterns of change by doing simulations with much higher rates.

For convenience we could start with a mutation rate and uptake bias that let the simulation reach equilibrium in 20 minutes, and test higher and lower rates, keeping the bias constant. Does a higher rate mean more USS or fewer? How big is the effect of a 2-fold change in rate? A 4-fold change? A 10-fold change? What happens to the imperfect USS? Next we can keep the rate constant and vary the bias. Does a 2-fold higher bias give more USS? How many more? What about a 2-fold lower bias? What happens if we change both mutation rate and uptake bias, keeping the ratio constant?

Such experiments can suggest the fundamental properties of the system even though they use very unrealistic values. Once this is done, there are several more directions to go.

First, we don't need to just assume that the properties we've found are likely to hold at more realistic values of rate and bias. Once we understand what happens when mutation rates are unrealistically high, we can think clearly about whether this should change when mutation rates are much lower. We can test our thinking by making a prediction of what we should see in runs with lower mutations rates, and then doing a few runs that test our predictions. If we have also tracked how long each simulation took to reach equilibrium, we'll be able to predict how long these more realistic runs should take, letting us decide whether they're practical or not.

Second, we can devise new tests based on our observations. For example, we should start with simple simulations where cells have no bias towards imperfect USS. But once we understand the properties of these simulations, we can introduce this extra bias and see what happens. Better, we can first predict what we think should happen, then test our predictions. These predictions and tests can be done at high mutation rates so they run fast. Once the results are in, we can consider whether we expect the same effects at low mutation rates, and test key predictions.

Once we're fairly sure of the results, we can work on polishing the paper that will report them. And because paper-polishing takes a long time, we can have a few key simulations running at very low mutations rates while we do this. The final paper will either report that the very low rates gave the expected result, or consider why they didn't.

Starting when the job's half done

I did a lot of work on the CIHR grant proposal in July, because I was aiming for a Sept. 15 deadline, until I realized we could easily afford to defer it to the Feb. 28 deadline. This makes the job much less daunting.

So I spent part of yesterday reading over what I'd written last summer, and some of what I wrote for the previous proposal (2001). A big part of the work will be organizing what we already know into a coherent story.

It's scarily easy (for me) to forget results of past research. For example, in previous posts here I've speculated that the purine repressor PurR might repress the rec-2 gene. But in the 2001 proposal I wrote that the previous grad student who had knocked out the purR gene had shown that it does exactly that! Now I need to go through his old notebook to find the data - if it's solid (his data usually was) I can include it in the new proposal or even in the purine regulation paper we will be writing.

Next day: The student was a careful worker, but this particular result wasn't very reproducible. That's probably why I forgot about it.

Important but not urgent

An article I read about running a lab emphasized using the distinctions shown in the figure to prioritize our activities.

Some things are both important and urgent, and these we should do right away. Other things are neither important nor urgent, and we probably shouldn't do them at all. The problems arise with the things that are important OR urgent, but not both. How do we decide which to do?

It's all too easy to rush around doing things that are urgent even though they're not particularly important to our big-picture goals. But that's a mistake. Instead we need to constantly make an effort to do the things that are important even though there's no rush and they could be put off.

This is scary if you're not absolutely confident about your ability to tell what's really important. Some urgent things probably won't get done at all; what if they were more important than you realized???

Anyway, I'm confident that preparing the big grant proposal that's due in February is very important, even though it's not yet urgent. I find writing in this blog much easier than writing in a 'draft proposal' file, so I'm going to try to do much of the proposal thinking and explaining here.

The proposal is to the Canadian Institutes of Health Research (Canada's version of NIH). It will probably go to the Infectious Diseases panel (I'm not sure that's exactly what it's called). I'm going to propose to answer most of the questions I've been raising here, under two subheadings:
  • How does H. influenzae decide to take up DNA?
  • How does H. influenzae take up DNA?

  • These questions cover most of the research we do. I won't include one post-doc's work, on how and why H. influenzae cells lose the ability to take up DNA, as she is independently supported by a fellowship, and as I want to reserve this project for a separate grant proposal to NIH (important but not at all urgent until we have preliminary data).

Motif analysis update, part 3: covariation

The third question I asked about the USS motif was whether there is evidence for interactions. My query to the EvolDir list produced three applicable programs. One looked difficult so I left it as a last resort. A second had been written by a colleague (in Fortran! He's an old-fashioned guy (we were post-docs together)). He kindly offered to try running our preliminary sequence set for us, and sent a monster Excel file full of the statistical results, with the 24 significant ones highlighted. There's a strong risk of spurious correlations in this kind of analysis, but the ones he found seem likely to be genuine, as they are almost all between adjacent positions.

In the meantime I'd also been trying out a program that had a lovely simple web interface. But it found only two covarying positions, and these seemed very weak (i.e. their squares on the matrix were only a tiny bit darker than the background. I was attracted to this web program because its matrix display of the results seemed so intuitive, but quickly realized that this simplicity was failing to tell me what I need to know. After a lot of back and forth with a helpful expert (= person who let his email address be linked to the web page) I now have a folder full of the software and associated files (ReadMe, Help), and can begin working out how to run it for myself.

Aaarrgghhhh! It's written in a programming language called GAWK/NAWK. Wikipedia says AWK was a precursor to Perl, and runs in Unix; GAWK is GNU-AWK. Thanks, that's a big help. Mac OS 10.4 doesn't have GAWK, just AWK. I hope Westgrid has GAWK.

Motif analysis update, part 2: coding direction

The second of my three questions about the USS motif was whether, for the large subset of USSs that are in genes, the orientation of USSs with respect to the proteins they help code for affects their motif consensus. So my plan was to assemble all the coding sequences of the genome, all oriented in the direction their proteins are specified (not in the direction their DNA is replicated), and to then compare the motifs of the USSs in the two possible USS orientations.

Assembling the sequences seemed straightforward (download in one file from TIGR, remove unwanted characters). But the motif-search program couldn't find the USSs I knew were there (see last week's post). I spent a week or more trying more tests and variations, to try to figure out what was going wrong, because I didn't feel that I understood the problem well enough to clearly explain it in an email to the helpful expert. Was the number of sequences over the limit? Were the 'N's I'd had to insert causing problems? Were the sequences too short? Was the problem dominant or recessive to a well-behaved sequence?

Yesterday the same problem appeared in some new sequence files, and then was corrected (see previous post). I wasn't entirely sure what I'd done that made the difference, but this did give me confidence that the problem with my gene sequence files was in the formatting, and my prime suspect was the hated carriage returns. These are a nightmare for Unix beginners like me - they're often invisible, they come in several incompatible flavours (Mac vs PC vs Unix), and Unix/Linux is very fussy about them. I can't remember exactly what I did, but I think it involved global search-and-destroy missions against carriage returns in both Word and Unix, then global restoration of the important returns in Word, then a passage through the text editor Mi to convert any Mac-style returns to Unix ones. And presto, the problem seems to be solved!

So while I've been sleeping the program has been busy searching the gene sequence file for USS motifs, and later this morning I hope to be able to compare the forward- and reverse-direction motifs. We know that protein coding constraints do affect the reading frame that USSs are found in - for each USS orientation there's a preferred reading frame that USSs are best tolerated in. So it's reasonable to suspect that the USS consensuses might also differ between the orientations. If they do, we'll understand a bit more about how natural selection acts on USSs.

Later: No, I was overly optimistic. The program is able to find a short version of the USS motif (10bp) but it can't find anything when asked to search for the full-length motif (22bp). I suspect it needs to be given a stronger prior expectation than just the spacing I'm giving it. Maybe I'll try suggesting the consensus sequence.

Motif analysis update, part 1: replication direction

Last week I asked three questions about uptake signal sequences (USS). Here's the first:
1. Does the direction in which a sequence is replicated affect the consensus of its USSs? That is, do USSs whose "forward" orientation sequence is found in the leading strand during DNA replication have a slightly different consensus than those whose "reverse" orientation sequence is in the leading strand? I raised this issue at the end of an earlier post, but I haven't tested it yet. All I need to do is to get the sequence of each strand of the genome, chop them at the origin and terminus of replication, and then put the parts together so all the leading strand sequences are in one file, and all the lagging strand sequences are in another file. Then run both files through the motif search.
Yesterday I finally set out to test this.

I had expected that the tricky step would be assembling the parts of the genome sequence into the two files, and I was right. We teach the concept of DNA having two antiparallel strands as if it was simple ("5' end, 3' end, how hard can this be?") but it's full of traps for the unwary. I had made (on the hall whiteboard and in my notebook during a boring seminar) preliminary sketches of the relationships between the physical strands of the genome, the location of the origin and terminus of replication, the structure of the bidirectional replication forks, and the 'forward' and 'reverse complement' DNA sequences available from TIGR. But I still got muddled and had to supplement my fresh pencil sketches with a new complex multi-coloured drawing on the whiteboard and an attempt to explain it to a passing post-doc. (The image is taken from here.)

I double-checked the final files by making sure that the 8 or 10 bases at the end of each were complementary to what I thought should be the corresponding end of the other file's sequence, and they were, so I think I've got it right. But I should triple-check then today, especially if the answer looks interesting.

The sequence files then had to be massaged into a form the motif-search program could handle: get rid of carriage returns, remove unacceptable characters (AGCTN are OK, others aren't), chop into 9kb segments). Throw out files and repeat, this time removing the extra bits of identifying text first. Throw out files and repeat, typing commands correctly (curse you, command line interface!).

And then the motif-search program scorned my sequences! The problem appeared to be the same one I was having with my gene-sequence files (next post); the program would appear to be processing the sequences as it should, but at the end it would shrug and say "sorry, I didn't find any patterns", even though I knew the patterns were there. Suspicion centered on the carriage returns, so I threw out the files and did everything again.

Success! The files were acceptable, and the motif search appeared to be actually searching, rather than just going through the motions. So I set up two runs, one with the leading strand sequences and one with the lagging strand sequences, and later this morning I should have the results.