


There are really two issues: (1) what information do we have about how the sequences of DNA fragments affect which fragments competent H. influenzae cells take up?; and (2) how should we represent that information?. (Hmm, some confusion about punctuation here...)
(1) What information do we have about uptake specificity?
As I wrote yesterday, the information comes mainly from two kinds of analysis, uptake bias and genome abundance. Each kind of analysis produces a set of sequences whose similarities can be examined and represented in various ways.
Uptake bias experiments directly measure how many molecules of different DNA fragments are taken up by competent cells, and compares the sequences of these fragments. The papers describing these experiments appeared at least 15 years ago, and the experiments had various weaknesses. One of our postdocs is presently doing a more detailed analysis under more controlled conditions (see my Importance of USS positions post, and the USS-R-US blog). The original experiments used natural fragments of the H. influenzae genome; these were followed by experiments using fragments containing synthetic USS cores and using fragments from the genome of the H. influenzae phage HPi.
These experiments are fussy and time-consuming, so only a small number of fragments have ever been analyzed; I've assembled the results into a single Word file for comparison. They are sufficient to establish that fragments containing the 9bp sequence AAGTGCGGT (or sequences very similar to this) are taken up much more efficiently than fragments with very different sequences. The results also suggest that fragments with AT-rich sequences flanking this 'core' USS are taken up better than those with GC-rich flanking sequences.
This information was represented simply by the core consensus AAGTGCGGT, and most subsequent analyses have focused on this repeat. However this simple representation fails to capture the complexity of even what was known 20 years ago, and the focus on it has not been very helpful.
Things changed as soon as the H. influenzae genome sequence became available. Now it was possible to do the second kind of analysis, examining the abundances of different USS-related repeats in the genome (see Smith et al. 1995 Science 269:538). These repeats are thought to probably reflect the biases of the DNA uptake machinery - we are testing this assumption.
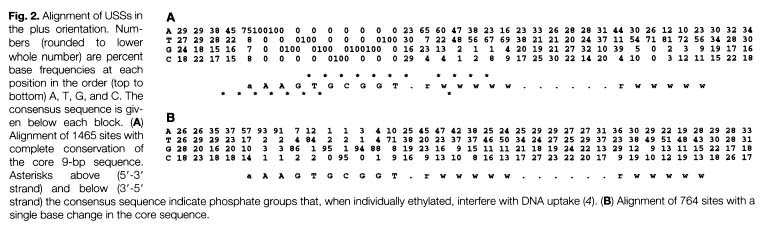
The above representation is taken from Smith et al. They searched the genome for every copy of AAGTGCGGT (in either orientation), and aligned the 1465 sequences this gave. The figure summarizes this alignment by showing the frequency of each of the four bases at each of 50 positions centered on the USS core. It gives no information about the core itself, but shows that some of the sequences to the right of the core have clear AT-rich consensuses (indicated by 'r' or 'w').
To get some information about the core iteslf, Smith et al repeated this analysis using 50bp segments contianing imperfect ("one-off") USSs. This analysis showed that some positions in the core have a stronger consensus than others. But the genome contains only about half as many one-off USSs as perfect USSs (~, and these are divided among 27 different ways to vary, so the effective sample size was quite a bit smaller than for the perfect USSs.
Since then we have done our own analyses on various genomes (see links to the USS-2006 and USS-2004 papers).
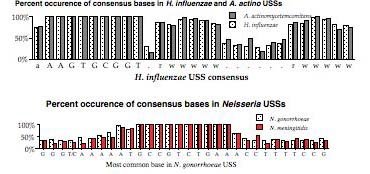
Our first alternative representation was a bar chart summarizing the strength of the consensus at each position. This was used for a NIH grant proposal, and later published in a paper with Wang that's not in the link list yet.
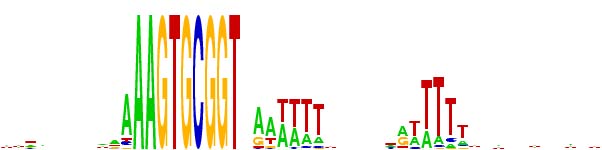
But lately we've been using a different representation scheme - "sequence logos". The multicoloured logo shown below is based on the same information as the table from the Smith et al. paper. Each stack of letters (or absence of stack) represents one of the 50 positions, and the height of each stack indicates how strongly the proportions of the bases differs from that expected of a random sequence. The size of each letter in the stack indicates its frequency at that position. By giving a visual representation of the proportions of each base at each position, it displays the alternatives at each position and the strength of the consensus much more directly than the Smith et al. table.
One remaining weakness is that the sequences used to generate the logo (or the Smith et al. tables) require starting with a specific sequence or set of sequences (e.g. perfect USS or set of one-off USSs). This means that the result will inevitably overrepresent whatever was searched for, and may underrepresent the strength of consensus at flanking sequences.
In the USS-2006 paper we made a small attempt to compensate for this, by also searching the A. pleuropneumoniae genome for some of the flanking consensuses. But what we really need to do is an 'unbiased' search of the whole genome for overrepresented sequence motifs. A grad student is familiar with programs that do this; he's been using them to search for the CRP-S promoter motifs in various genomes. But I don't know how easy it would be to modify them to search a genome.
Another remaining weakness is that the various consensus analyses tell us nothing about any tendency for the variation at any one position to be correlated with (??) the variation at any other position. For example, one comment to yesterday's post explained that the sequence TATA is much more flexible than other tetramers. But the consensus representations encourage us to think only of strings of AATTTTs and ATTTTT, and not to consider how many USS might have TATA in their flanking sequences.
Your pictures don't show up.
ReplyDeleteI think there are probably programs available that search whole genomes looking for motifs. I would be surprised if there are not. But, it should be really easy to do in PERL. Isn't that what we're doing in the program now....searching the random and mutated/converted DNA for a sequence?
I just realized that the pictures show up if I use Safari but not FireFox?
ReplyDelete