Field of Science

Comments on Dr. Wolfe-Simon's Response

Preliminary Response to Questions Concerning the Science Article (from F. Wolfe-Simon, Dec. 16, 2010)


(In this post I'm only addressing the specific points made in this Q&A. Magenta numbers identify points I have concerns about. As always, I'm not asking readers to take my word for anything; if you have doubts you should look up the information and check my calculations for yourself.)


Question:
Some people have questioned whether the DNA was sufficiently cleaned by your technique using gel electrophoresis, to separate it from other molecules. Do you feel this is a valid concern?
Answer:
Our DNA extraction and purification protocol begins with washed cells, pelleted from media. These are then subjected to a standard DNA extraction protocol (1), which included multiple phenol chloroform steps to remove impurities, including any unincorporated arsenate (As) (2). After this, the DNA was electrophoresed, further separating the DNA from impurities (3, 4). Any residual As from the media would have been removed by washing the cells prior to extraction (5) and by partitioning into the aqueous phase (6) during the 3 phenol:chloroform steps in the extraction. If As was incorporated into a lipid or protein it would have partitioned into the phenol, phenol:chloroform, or chloroform fractions (7). Additionally, DNA extracted in this manner on other samples was also successfully used in further analyses, including PCR (8), that require highly purified DNA (9).
The arsenic measured by NanoSIMS in the gel band is consistent with our other measurements and another line of evidence.
Our radiolabeled 73AsO43- experiment showed that of the total radiolabel associated with the cell pellet 11.0 % ± 0.1 % was associated with the DNA/RNA fraction (10). This indicated that we should expect some arsenate of the total pool associated with the nucleic acids (11). To interpret these data, we coupled our interpretation with our EXAFS evidence suggesting that intracellular arsenic was As(V) bound to C (12), and was not free in solution as an ion. This suggests the As is in, an organic molecule with bond distances consistent with a chemical environment analogous to phosphate (Figs. 3A, S3 "bond lengths" table). Further supporting our interpretation of the previous mentioned two analyses, we used a third line of evidence from NanoSIMS, a completely different technique from the other two. We find elemental arsenic (as measured by NanoSIMS) associated with the gel band that is more than two times the background in the gel (13). Based on the above discussion, we do not feel this is a valid concern.

My concerns:
(1) The DNA extraction procedure included only some of the components of a standard DNA extraction protocol.  First, only a single ethanol precipitation was done, whereas getting relatively pure DNA requires at least two rounds of extraction and precipitation.  Second, the pellets were not washed, so that unincorporated arsenate (or phosphate) present in the aqueous fractions may have been precipitated with the DNA, and may also have been present in the alcohol supernatants contaminating the pellets.  Third, no column clean-up step was done.
(2) This statement implies that unincorporated arsenate in the cell lysate would partition into the phenol and chloroform.  This seems a priori improbable, as arsenate is very soluble in water.  No controls were done to find out how unincorporated arsenate or phosphate would partition in these extractions.
(3) Gel electrophoresis can remove impurities but it is not guaranteed to do so.  Any impurities that migrate at a similar rate to the DNA, or are electrostatically associated with it, will be present in the gel slice.  Any impurities that diffuse into the gel buffer may become distributed throughout the gel.  Any impurities already present present in the agarose or gel buffer will also be in the gel slices.  These concerns are strengthened by the failure to purify the DNA away from the gel slice (see (13) below).
(4) No control was performed for non-covalent association of arsenate (or phosphate) with DNA.  In another control extraction, arsenate and lysis solution should have been mixed with previously purified DNA from E. coli or other phosphate-grown cells, to see if any arsenic co-purified with the DNA. 
(5) No control was performed for the effectiveness of this washing.  E. coli or other cells grown in the absence of arsenate should have been mixed with the +As/-P medium and then subject to the same washing and extraction steps.
(6) Here arsenate is predicted to partition into the aqueous phase.  Is this the same arsenate that partitioned into the phenol and chloroform in (2) above?
(7) In the ICP-MS analysis presented in Table S1, almost all the arsenic did partition into the phenol phase, and almost as much arsenic was present in the phenol fraction of the phosphate-grown cell (4725 vs 3683 ppb).  In fact, the aqueous phase of arsenate-grown cells contained no detectable arsenic at all, even though this is the fraction from which the arsenic-containing DNA was precipitated. 
(8) The online Methods say that DNA from all growth conditions, worked fine in the PCR reactions used for the phylogenetic analysis.  This strongly suggests that the DNA from arsenate-grown cells has a normal phosphorus backbone.  The polymerases used for PCR have very high fidelity and would not tolerate substitution of arsenic for phosphorus.
(9) PCR does not require purified DNA; it even works very well on whole-cell lysates.
(10) See point (7)
(11) But this pool is expected to contain all of the water-soluble constituents of the cell. The elemental analysis report that the arsenic was bonded to carbon doesn't mean that it is bonded to DNA.  And most of this arsenic partitioned into the phenol phase - is it thought to be lipid?  If so, maybe the arsenic is bonded to C in lipids.  
(12) Wait!  IANAC (I am not a chemist), but if the 'intracellular arsenic was As(V) bound to C' then it couldn't be arsenic incorporated into DNA or RNA, as it would then have to be bound to O in DNA's diester backbone.
(13) Let's think more about the arsenic in the gel bands.  The whole gel slices were assayed (the DNA was not purified away from the agarose); since the gel is 1% agarose and a gel slice is unlikely to weigh less than 100 mg, each slice would contain at least 1 mg of agarose. The DNA bands in Fig. 2A are unlikely to contain more than 1 µg of DNA, probably less for arsenate-grown DNA in lane 2).  Thus we can generously assume that 99.9% of the carbon in each DNA sample came from the agarose, and no more than 0.1% from the DNA.  According to the figure legend and the numbers at the bottoms of the gel lanes the arsenate-grown sample had 13.4 atoms of arsenic per 10^6 atoms of carbon.  This is 13.4 arsenic atoms per 1000 DNA carbons.  Since A, G and T nucleotides contains 10 carbons  and C has 9, this is 13.4 arsenic atoms per 102.6 nucleotides, or about 26 per 100 base pairs.  That's quite a lot of arsenic.  Even more surprising, the phosphate-grown sample had 6.9 arsenics per 10^6 carbons, which would be about 14 arsenics per 100 bp.  The gel blank had even more arsenic, and three times as much phosphorus.  This strongly suggests that the gel was contaminated with both arsenic and phosphorus, perhaps introduced with the DNA samples.  Until such contamination can be ruled out, the two-fold higher arsenic concentration and three-fold lower phosphorus concentration associated with the arsenic-grown DNA sample cannot be seen as significant.

Question:
Others have argued that arsenate-linked DNA should have quickly fallen apart when exposed to water. Could you address this?
Answer:
We are not aware of any studies that address arsenate bound in long chain polyesters or nucleotide di- or tri-esters of arsenate, which would be directly relevant to our study. Published studies have shown that simple arsenic esters have much higher hydrolysis rates than phosphate esters (1-3). The experiments published to date have specifically looked at the exchange or hydrolysis of alkyl tri-esters of arsenate [Eqn. 1] and alkyl di-esters of arsenite [Eqn. 2]:
OAs(OR)3 + H2O → OAs(OH)(OR)2+ ROH [1]
OAs(OH)(OR)2 + H2O → OAs(OH)2(OR) + ROH [2]
where R = methyl, ethyl, n-pentyl and isopropyl. Reference 2 demonstrated that the hydrolysis rates for these simple alkyl triesters of arsenate decreased with increasing carbon chain length (complexity) of the alkyl substituent (methyl > ethyl > n-pentyl > isopropyl) (14). No work has been done on the hydrolysis rates of arsenate-linked nucleotides or other biologically relevant moieties.
If the hydrolytic rate trend reported in Ref. 2 continues to larger-weight organics, such as those found in biomolecules, it is conceivable that arsenate-linked biopolymers might be more resistant to hydrolysis than previously thought (15). The small model compounds investigated in Refs. 1-3 are relatively flexible and can easily adopt the ideal geometry for water to attack the arseno-ester bond (16). Arsenate esters of large, bio-molecules, however, are likely to be more sterically hindered leading to slower rates of hydrolysis (17).
This type of steric constraint on reaction rate accounts for the wide range of rates seen in the behavior of some phosphate linked nucleotides. In small ribozymes, the phophodiester linkages at the site of catalysis can be hydrolyzed on the order of tens of seconds (with a chemical rate of 1 s-1). This rate enhancement is achieved by orienting the linkage for in-line attack by a nucleophile (an adjacent 2' hydroxyl group). Moreover, the autodegradation patterns are consistent with specific base composition. On the other hand, the hydrolysis rates for phosphodiester bonds in A form duplexes of RNA are many orders of magnitude slower, because these linkages cannot access easily the geometry necessary for hydrolysis.
The rates in DNA may be much slower than model compounds because of the geometrical constraints imposed upon the backbone by the helix (18).
The kinetics of the hydrolysis of arsenate-linked biopolymers is clearly an area where more research is warranted.

My concerns:
(14) Again IANAC.  But note that these are hydrocarbons and thus quite hydrophobic, especially the pentyl chain (5 carbons) and the isopropyl chain (3 branching carbons).  Attaching three of these by ester bonds to the arsenate effectively surrounds the bonds with hydrophobic shells that exclude water.  Thus it's not surprising that the hydrolysis reaction occurs less often.
(15) But if the increased stability described in Reference 2 (yes, I looked at this paper, and I'm trying to get hold of the 1870 reference too) is due to increasing hydrophobicity of the ester bonds' environment, then the effect will not extrapolate to long hydrophilic biological molecules such as DNA.
(16) Not if they're surrounded by a hydrophobic shell, and probably also associating with each other to reduce the shell's exposure to the aqueous solvent.
(17) DNA has its backbone on the outside of the double helix, and the entire molecule is quite hydrophilic.  
(18) Assuming the overall structure of arsenic bonds in DNA is like that of phosphorus bonds in DNA, shouldn't any stability-enhancing geometrical constraints of the DNA structure be experienced by both phosphorus and arsenic bonds?  We would then still expect arsenic bonds in DNA to be 100-fold less stable than phosphate bonds. 

Question:
Is it possible that salts in your growth media could have provided enough trace phosphorus to sustain the bacteria?
Answer:
The data and sample labeling in Table S1 has caused some confusion. To clarify, for every experiment, a single batch of artificial Mono Lake water was made with the following formulation: AML60 salts, no P, no As, no glucose, no vitamins. Table S1 shows examples of ICPMS measurements of elemental phosphorus (~3 µM) and arsenate made on this formulation prior to any further additions (19, 20). Then we added glucose and vitamins for all three treatments and either As for the +As treatments or P for the +P treatments. The P measurements made on the medium after the addition of sucrose and vitamins and after addition of As were also ~3 µM in this batch. Therefore, it was clear that any P impurity that was measured (~3 µM, this was the high range) came in with the major salts, and that all experiments contain identical P background (including any P brought in with the culture inocula).

In the Science paper, we show data from one experiment of many replicated experiments that demonstrates no growth of cells in media without added arsenate or phosphate (Figure 1). These data clearly demonstrate that strain GFAJ-1 was unable to utilize the 3µM P to support further growth in the absence of arsenate (21). Moreover, the intracellular P content determined for the +As/-P grown cells was not enough to support the full requirement of P for cellular function (22).
Note on culturing: All experiments were initiated with inocula from sustained +As/-P conditions. Prior to the experiments, the cells had been grown long term, for multiple generations from a single colony grown on solid media with no added phosphate. Before this, they were grown as an enrichment for more than 10 transfers and always into new medium that was +As/-P. We therefore feel that there is not significant carry-over of P. We also argue that there would not have been enough cellular P to support additional growth based on an internal recycling pool of P (23).


My concerns:
(19) The two batches of AML60 salts assayed contained 3.7 and <0.3 µM P, and the single batch of cell wash solution contained 7.4 µM P.  Given this variability, the similarity of the two batches of -P/+As medium doesn't inspire much confidence.
(20) Was no effort made to identify and eliminate the source(s) of this contamination?
(21) Agreed, with the proviso that the media be tested and shown to be identical except for the phosphate and arsenate.  But this wouldn't mean that arsenic replaced phosphorus in any biological molecules in GFAJ cells, just that the cells needed arsenate for something.
(22) Did this calculation take into account the very high carbon content of the poly-hydroxybutyrate granules in these cells?  PHB can account for up to 90% of the dry weight of phosphate-starved cells, and its carbon will skew estimates of C:P ratios.
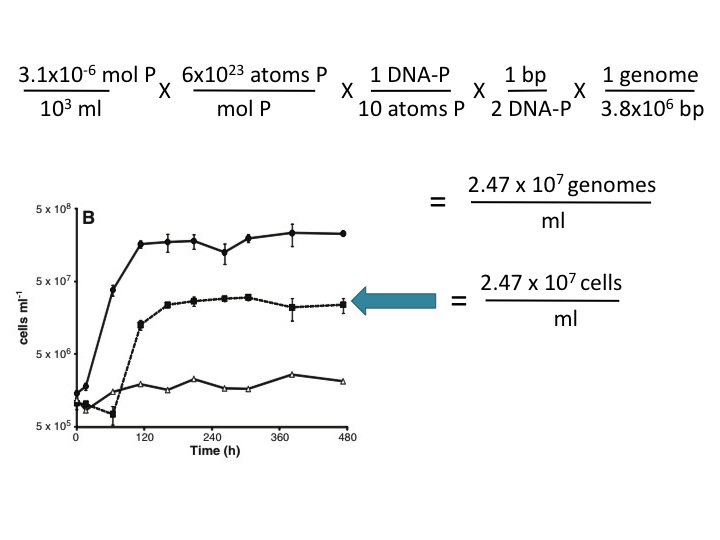
(23) This assertion is not supported here by any evidence, and it is contradicted by the Makino et al. (2003) reference cited by the Science paper (ref. 13). These authors found that 10% of the P in phosphate-limited E. coli is in the DNA and the rest is in RNA and other cellular components.  Using this value and your own estimate of genome size (3.8 Mbp), ~3 µM P is sufficient to account for the observed growth in the -P/+As medium. Here's the calculation:  


The FedEx saga continues

Regular readers (all 5 of you) may remember last week's unsuccessful attempt to ship some of our bacteria to London.  FedEx returned our package to us because we hadn't met all their stringent requirements for infections bacteria.

This afternoon we went back to Shipping and Receiving with all the new correct FedEx paperwork and our 24 vials of bacterial cells.  The vials were in a plastic box, in a special leakproof container, in this container's specially labeled cardboard carton, in a big styrofoam container for the dry ice, in a very big cardboard box labeled OVERPACK.

Only to learn that Shipping and Receiving had run out of dry ice! 

It was too late to rush over to Chemistry Stores to get dry ice, as we'd miss the FedEx pickup time.  I briefly considered finding an open-late FedEx office and hand-delivering the package to them.  This would have involved sending someone over to Chemistry Stores to get the dry ice while I rode my bike home (5 miles) to get my car.  But then I remembered that I'm probably not authorized to even touch this hazardous-goods shipment, much less drive it around town.

Shipping and Receiving won't have dry ice until the day after tomorrow, so tomorrow one of us will go over to Chemistry Stores and get the dry ice we need, and we'll try yet again to get the shipment on its way to London.

How to harness distributed discussion of research papers

In this post I'm going to elaborate on a suggestion I saw a few days ago, in an article discussing the role of post-publication commentary in science.  (And yes, I'm searching for the source of this idea - if any reader remembers whose it was, please point me to it.)

In modern but pre-internet days, researchers did the research, wrote the paper, submitted it to peer review, made changes, and published it.  Other researchers them evaluated this information, using to guide their own work, and discussed its strengths and weaknesses when they cited it in their own papers. 

Published papers were also discussed less formally with colleagues, both before and after publication,  face-to-face and by mail and phone, and in journal-club presentations and seminars.  The ideas from these discussions were incorporated into the formal papers drawing on this work, but they weren't available to anyone but the direct participants.

Now that we're all on line, published papers are also being discussed more publicly, in blogs and other places.  Such discussions are extraordinarily valuable for the progress of science - they're written public evaluations, drawn from a wide range of expertise, and usually greatly enriched by comments from and links other researchers.  But these pages are all over the place, and finding them requires a lot of active searching.

The Research Blogging site is helping with this problem, by aggregating blog posts that discuss individual research papers.  But they can only link to posts that actively insert their code, and so miss quite a lot of the public commentary.  So far the journals don't link their papers to this site, so readers who go looking for the paper don't usually think to also check Research Blogging.

A few forward-thinking online journals (PLoS and BMC groups, I'm talking about you) provide their own Comments thread for each paper, so other researchers can provide informal but public feedback .  But the researchers don't use these, saying that they don't feel comfortable doing this publicly, or that they don't like the bother of having to register and log on.  I know that's true for me, thought I don't know why - I'll happily blog about a paper I've read, but I almost never post comments on its official Comments page.

Sites like The Third Reviewer have tried to solve this by providing journal-independent sites where researchers can post comments about papers.  But we won't use these either -the massive wave of discussion about the Wolfe-Simon paper on arsenic bacteria let to exactly zero comments on The Third Reviewer.

Most journals already provide, with each paper they've published, a list of links to the more recent papers that cite it.  The suggestion I really liked was that the journals should also aggregate the informal commentary, by providing a separate list of links to ALL the web pages that have link to the paper.  Journals could then stop fighting our unwillingness to post comments centrally, and just use our distributed posts to add value to the papers they publish.

I don't think this would be very difficult; lots of sites already have a 'Who links here?' feature, and I think both Google and Yahoo searches can be restricted to sites containing a specific url.  The journals could include an explicit disclaimer that the journal in no way vouches for the value or creditability of the information in these links.  A few bloggers might have to become a bit more circumspect (probably not a bad thing), and any blogger who didn't want their post linked to the paper could provide a citation to the paper but not link to it.

Jon Eisen,  do you think this could work?  If PLoS leads, I bet the others will follow.

An apologetic email

Note added Dec. 13:  The author of the ABC article has modified it (even though he had accurately quoted what I'd said to him), and he now also quotes from this email.

Dear Dr. Wolfe-Simon,

I'm emailing you to apologize for quotes from me that have just appeared on the ABC News website.  I wasn't misquoted, but some of the things I said in a phone interview yesterday morning came across more harshly than I had intended.

I told the interviewer that, even though I think your conclusions were wrong, I sympathize with the difficult position you're in (I've spent about 20 years championing a hypothesis that almost everyone thinks is wrong).  I also said that what matters in science isn't whether we make mistakes (we all do) but how we deal with them, and that I think you're handling the situation well.

I feel particularly bad about the 'not calm and confident' quote, because in fact your press conference was very well done.  I meant this statement to only emphasize that women in science know that they're being judged harshly, but instead I came across as someone doing precisely that.

Sorry,

Rosie Redfield

p.s. to everyone else:  I don't want this post to become a place to debate speaking styles so I'm going to close comments (or delete them if I can't figure out how to close them).  My apologies to the four people who've already commented, as I'm about to delete your comments.

Back to blogging as usual

But I can't resist first posting this fabulous photo-mashup of a face-off between myself and Felisa Wolfe-Simon (from Gizmodo):

Now, where was I?  Last week's transformation experiment worked quite well.  I didn't get nearly as many NovR and NalR transformants as I had expected, and some of the plates had contaminants, but I ended up with five independent pools containing between 5,000 and 50,000 independent clones each.  So I diluted each pool to about 3 x 10^9 cells per ml, added glycerol, and froze four aliquots of each pool in nicely labelled tubes, all ready to FedEx to London (England, not Ontario) on Monday.

Well, it's Thursday, and the cells are still in our freezer.  Actually they're back in our freezer, because we shipped them out yesterday afternoon, thinking we had met all the requirements, and this morning FedEx brought them back.   (But we still have to pay them for this on-shipment!)

The problem is that these are infectious bacteria, and the shipping agencies enforce very strict regulations about packaging and labelling.  I think some central agency (government) must make the regulations, and packages must be prepared for shipping by a person who's taken a special training course in transport of hazardous goods.  I probably should have realized this, but I didn't, and we had a really hard time finding the information we needed.  (We haven't had to do this in the past - we've usually just sent people DNA rather than cells.)

Our Shipping and Receiving office originally told the RA to talk to Health and Safety, and Health and Safety didn't return the RA's call or her email.  So on Tuesday I talked to FedEx, and then I called up Health and Safety and found out that (1) the shipper had to have taken a course; (2) it's not the kind of course you can just take in an hour online; (3) a technician in our building had taken the course and might help us.  Then she told us that the manager of Shipping and Receiving had the training we needed, and sure enough he did. But it was too late to do it then.

He was busy Wednesday morning, but yesterday afternoon we took the frozen cells inside the special o-ring sealed plastic container inside the specially labelled cardboard box (we had received the container and box when someone else had shipped cells to us) inside the big styrofoam box.  He got us the dry ice, checked all our paperwork and labels, signed the forms, and put his cell phone as the emergency 24-hr contact number.  The RA had already set up the shipment online and printed out the waybill and commercial invoice (3 copies) and the Dangerous Shipment declaration (3 copies, each printed in colour on the lab next door's printer).  She taped the styrofoam box shut and put in the special FedEx pickup place, and we both heaved sighs of relief.

But this morning the box came back.  Once it had reached FedEx's central clearing house they'd gone over it with their 900-point checklist (I exaggerate only slightly) for hazardous-goods shipments, and it had failed.  Not just one point - there were Xs in about ten of the boxes.  We had forgotten to write the weight of the dry ice on the form.  The shipping guy had forgot to sign one of the forms in one of the places, and to resign at somewhere a change had been made.  Our styrofoam box needed to be inside a cardboard box, which must be labelled "OVERPACK".   The Dangerous Shipment form must describe the contents with very precise wording.  And it must not be completed by hand - of course we don't have a typewriter, and it's on a pdf form that can be typed into but not saved, so we'll ask the lab next door to let us borrow one of their computers as well as their colour printer - we can't just complete the form on one of our computers and send it to their printer because we're in different departments and thus our computers are on different networks.

Because the shipment will probably take longer than overnight to get to London, we didn't want to send it on a Thursday or Friday and risk having it sit around getting warm all weekend.  So we're getting everything ready again to send it on Monday.

Interested in doing research in my lab?

I'm taking advantage of this barrage of visitors to spread the word that my research group has openings for both a graduate student (M.Sc. or Ph.D.) and a postdoctoral fellow.  We investigate the molecular biology and evolution of bacteria DNA uptake; you can read more about us at our home page, and find the details of our current research plans in our latest grant proposals.

My Letter to Science

(If you're looking for the long post I wrote on Saturday, the one that started the controversy about the Wolfe-Simon arsenic bacteria paper by describing all the problems I found, it's here.)

Below is the text of my formal Letter to Science about the Wolfe-Simon paper.  Letter submissions are supposed to be limited to 300 words (this is a bit over at 371), so I'm only bringing up the issues concerning contamination.  This is an improved version that incorporates many of the suggestions provided in the comments below.  So some of the comments (in the first 10-15) won't make sense any more.

Because this paper has LOTS of other problems, it would be great if many other researchers could also submit Letters and Technical Comments (limit of 1000 words, peer-reviewed).  Here's a link to the Instructions for Authors entry page.  I won't mind if your Letter gets accepted and mine doesn't.

Here's mine:


Wolfe-Simon et al. (1) meticulously eliminated contamination of the reagents and equipment used in their elemental analyses, but they made much less effort to eliminate contamination in their biological samples.

The reagents used for the culture media were not pure.  The 3.1 µM PO4 contaminating the As+/P- medium provided enough P for all of the cell growth seen in this medium, using the authors’ estimate of 7.5x10⁶ atoms of P per genome and the generous assumption that phosphate-starved cells use 90% of their P for molecules other than DNA (2).  This calculation (not done by the authors) obviates their hypothesis that the cells could only grow by replacing P with As.

An independent contamination problem is the omission of standard DNA purification steps when testing for As in DNA (2).  Contamination is typical in DNA/RNA pellets produced by ethanol precipitation of the aqueous phases from phenol:chloroform extractions.  This is partly because this fraction contains most of the small molecules from the cytoplasm (contrary to the authors’ assertion), which are often less soluble in 70% ethanol than in water.  Pellets are also typically contaminated with small amounts of the ethanol supernatant.  Yet the usual step of washing the pellets was omitted, and the dried pellets were simply resuspended in water and loaded on an agarose gel.

Most surprisingly, the chromosomal DNA fractions (boxed in Fig. 2A) were not purified from the gel slices (a standard ten-minute procedure).  Instead the authors simply dried the gel slices and assayed them.  Not only does this bring in any contaminants present in the gel, but since each gel slice would have contained at least 1 mg of agarose (100 mg of 1% agarose gel), and each DNA band no more than 1 µg of DNA, at least 99.9% of the carbon in these samples would have come from the agarose, not the DNA.  No correction can be made for the agarose-derived C because the actual amounts of DNA and agarose are not known.  Omission of the gel-removal step for these critical samples is surprising because the authors did use it in preparing the rDNA fragments they sequenced for their phylogenetic analysis.

1.      Wolfe-Simon F, Blum JS, Kulp TR, Gordon GW, Hoeft SE, Pett-Ridge J, Stolz JF, Webb SM, Weber PK, Davies PC, Anbar AD, & Oremland RS (2010). Science Express. PMID: 21127214
2.      W. Makino, J. Cotner, R. Sterner, J. Elser, Funct Ecol 17,121 (2003).
3.      J. Sambrook, D. W. Russell.  Molecular Cloning, A Laboratory Manual. 3rd Ed.  Cold Spring Harbor Press, New York 2001.

Arsenic-associated bacteria (NASA's claims)

ResearchBlogging.org

Wolfe-Simon F, Blum JS, Kulp TR, Gordon GW, Hoeft SE, Pett-Ridge J, Stolz JF, Webb SM, Weber PK, Davies PC, Anbar AD, & Oremland RS (2010). A Bacterium That Can Grow by Using Arsenic Instead of Phosphorus. Science (New York, N.Y.) PMID: 21127214

Note to visitors in 2012:  We've just submitted a manuscript to Science reporting the results of our unsuccessful attempt to replicate the key findings of this work.  The manuscript will be publicly available on the arXiv server beginning Feb. 1 2012.


Newer note to new readers:  See also my new (Dec. 16) critique of the authors' response to these and similar criticisms.)

Note to new readers:  I wrote this post on Saturday Dec. 4, mainly to clarify my own thinking.  I didn't expect anyone other than a few researchers to ever read it.  Since then I've made a few minor corrections and clarifications (typos, decimal places, cells not cfu), but I haven't changed anything significant.  Please read the comments - they contain a lot of good scientific thinking by other researchers.

Here's a detailed review of the new paper from NASA claiming to have isolated a bacterium that substitutes arsenic for phosphorus on its macromolecules and metabolites.  (Wolfe-Simon et al. 2010, A Bacterium That Can Grow by Using Arsenic Instead of Phosphorus.)  NASA's shameful analysis of the alleged bacteria in the Mars meteorite made me very suspicious of their microbiology, an attitude that's only strengthened by my reading of this paper.  Basically, it doesn't present ANY convincing evidence that arsenic has been incorporated into DNA (or any other biological molecule).

What did the authors actually do?  They took sediment from Mono Lake in California, a very salty and alkaline lake containing 88 mg of phosphate and 17 mg of arsenic per liter.  They put the sediment into a similarly alkaline and hypersaline defined medium containing 10 mM glucose as a carbon source, 0.8 mM NH4SO4 as a nitrogen and sulfur source, and a full assortment of the vitamins and trace minerals that might be needed for bacterial growth.  Although this basic medium had no added phosphate or arsenate, contamination of the ingredients caused it to contain about 3 µM phosphate (PO4) and about 0.3 µM arsenate (AsO4).  For bacterial growth it was supplemented with arsenate or phosphate at various concentrations.

The interesting results came from sediment originally diluted into medium supplemented with the highest arsenate concentration they initially tried (5 mM) but no phosphate.  Over the course of several months they did seven tenfold dilutions; in the sixth one they saw a gradual turbidity increase suggesting that bacteria were growing at a rate of about 0.1 per day.  I think this means that the bacteria were doubling about every 10 days (no, every 7 days - corrected by an anonymous commenter).

After one more tenfold dilution they put some of the culture onto an agar plate made with the same medium; at least one colony grew, which they then inoculated into the same defined medium with 5 mM arsenate.  They gradually increased the arsenate to 40 mM (Mono Lake water contains 200 µM arsenate).  Descendants of these cells eventually grew in 40 mM arsenate, with about one doubling every two days.  They grew faster if the arsenate was replaced by1.5 mM phosphate but grew only about threefold if neither supplement was provided (Fig. 1 A and B, below).  The authors misleadingly claim that the cells didn't grow at all with no supplements.

In Fig. 1 (below), the correspondence between OD600 (Fig. 1 A) and cells (Fig. 1 B) is not good.  Although the lines in the two graphs have similar proportions, OD600 is plotted on a linear scale and cells/ml on a log scale (is this a shabby trick to increase their superficial similarity?).  OD600 in arsenate medium was almost as high as that in phosphate medium, but the number of cells was at least tenfold lower.  And the OD in arsenate continued to increase for many days after the cells has leveled off.  I suspect most of the continuing growth was just compensating for cell death.  It would be interesting to test whether the cells were scavenging phosphate from their dead siblings.  (A researcher in my lab had a better explanation - I've put it in the Comments below.)


The authors never calculated whether the amount of growth they saw in the arsenate-only medium (2-3 x 10^7 cfu/ml) could be supported by the phosphate in this medium (or maybe they did but they didn't like the result).  For simplicity I'll start by assuming that a phosphorus-starved cell uses half of its phosphorus for DNA and the rest for RNA and other molecules, and that the genome is 5x10^6 bp.  Each cell then needs 1x10^7 atoms of phosphorus for DNA, and 2x10^7 for everything.  The medium is 3.1 µM phosphate, which is 3.1x10^-6 moles per liter.  Mutiply by Avogadro's number (6.02x10^23 atoms per mole) and we have 1.9x10^18 atoms of phosphorus per liter, or 1.9x10^15 per ml.  Divide by the phosphorus requirement of each cell (2x10^7) and we get 9.5 x 10^7 cells per ml.  This value is just comfortably larger than the observed final density, suggesting that, although these bacteria grow poorly in the absence of arsenate, in its presence their growth is limited by phosphate. (Note:  This calculation originally dropped a decimal point.  I've changed it a bit and corrected the error.)

Under the microscope the bacteria grown with arsenate and no added phosphate (Fig. 1 C) look like plump little corn kernels, about 1 µm across and 2 µm long.  They contain many structures (Fig. 1 E) which the authors think may be granules of the wax-like carbon/energy storage material polyhydroxybutyrate (PHB).  Many bacterial cells produce BHP when their carbon/energy supply is good but other nutrients needed for growth are in short supply.  Cells grown with phosphate and no added arsenate are thinner and lack the granules (Fig. 1 D).  The authors used 16S rRNA sequencing to identify this bacterium as belonging to the genus Halomonas, a member of the gammaproteobacterial order Oceanospirillales.  Members of this group are diverse but not known to have any uniquely dramatic features.

According to an interview with the first author, this research was motivated by a desire to show that organisms could use arsenic in place of phosphorus.  The two atoms have very similar chemical properties, but bonds with arsenic are known to be much less stable than those with phosphate, so most researchers think that biological molecules containing arsenic rather than phosphorus would be too unstable to support life.  Thus the authors wanted to show that the bacteria had incorporated the arsenic in places where phosphorus would normally be found.  They used several methods, each involving a low-tech preparation of cell material and a high-tech identification of the atoms present in the material.
 
First they collected the bacteria by centrifugation, washed them well, and precisely measured the fraction of arsenic and phosphorus (as ppb dry weight, Tables 1 and S1).  Cells given only the arsenate supplement contained about 10-fold more arsenic than phosphorus (0.2% arsenic and 0.02% phosphorus) and cells given only the phosphate supplement had 0.5% phosphorus and only 0.001%  arsenic.

The authors argue that the arsenate-grown cells don't contain enough phosphorus to support life.  They say that typical heterotrophic bacteria require 1-3% P to support life, but this isn't true.  These numbers are just the amounts found in E. coli cells grown in medium with abundant phosphate.   They are very unlikely to apply to bacteria growing very slowly under phosphate limitation, and aren't even true of their own phosphate-grown bacteria (0.5% P).  The large amount of PHB in the arsenate-grown cells would have skewed this comparison - PHB granules are mainly carbon with no water, and in other species can be as much as 90% of the dry weight of the cells.  Thus their presence only in arsenate-grown cells could depress these cells' apparent phosphate concentration by as much as 10-fold.

The authors then grew some cells with radioactive arsenate (73-As) and no added phosphate, washed and dissolved them, and used extraction with phenol and phenol:chloroform to separate the major macromolecules.  The protein fraction at the interface between the organic and aqueous phases had about 10% of the arsenic label but, because the interface material is typically contaminated with liquid from the aqueous phase, this is not good evidence that the cells' protein contained covalently-bound arsenate in place of phosphorus.  About 75% of the arsenic label was in the  aqueous (upper) fraction.  The authors describe this fraction as DNA/RNA, but it also contains most of the small water-soluble molecules of the cell, so its high arsenic content is not evidence that the DNA and RNA contain arsenic in place of phosphorus.  The authors use very indirect evidence to argue that the distribution of arsenic mirrors that expected for phosphate, but this argument depends on so many assumptions that it should be ignored.

(They also measured the absolute amounts of arsenic and phosphorus in the supernatant fraction - surprisingly, no arsenic (<20 ppb) was detected in the fraction from arsenate-supplemented cells, although the fraction from phosphate-grown cells had 118 ppb!  See Table S1.)

They especially wanted to show that the cells' DNA contained arsenic in place of phosphorus, so they gel-purified chromosomal DNA from cells grown with arsenate (lane 2) or with phosphate (lane 3), and measured the ratio of arsenic to carbon by mass spectrometry.  The numbers at the bottom give these ratios (the legend says 'multiplied by 10^-6 but they surely mean 'multiplied by 10^6'). 


As expected, this ratio was very low for the phosphate-grown cells (6.9x10^-6), but it was only twofold higher for the arsenate-grown cells (13.4x10^-6).  Normal DNA has one phosphorus atom for each ten carbons (P:C = 10^-1), so the arsenate-grown ratio is only about one arsenic atom per 10,000 phosphorus atoms (i.e. one per 5 kb of double-stranded DNA).  A 2x10^6 bp genome would contain 4x10^6 atoms of phosphorus, so if all this arsenate was really covalently in the DNA, each genome would only contain about 400 atoms of arsenic.  And a phosphate-grown genome would contain 200!

Could 400 atoms of arsenate per genome be due to carryover of the arsenate in the phenol-chloroform supernatant rather than to covalent incorporation of As in DNA?   The Methods describes a standard ethanol precipitation with no washing (and no column purification which would have included washing), so I think some arsenate could easily have been carried over with the DNA, especially if it is not very soluble in 70% ethanol.  Would this arsenate have left the DNA during the gel purification?  Maybe not - the methods don't say that the DNA was purified away from the agarose gel matrix before being analyzed.  This step is certainly standard, but if it was omitted then any contaminating arsenic might have been carried over into the elemental analysis.

Failure to purify the DNA away from the agarose would also compromise their elemental analysis in other ways, since much of the carbon in the purified 'DNA' would have been from the agarose.  The authors did do the same elemental analysis on a gel slice with no DNA in it, a control that only makes sense if they didn't purify the DNA.  Not purifying away the gel might affect the arsenate-grown DNA more because the band contains less DNA; this would explain why this excised DNA has 3.5-fold lower ratio of phosphorus to carbon than the phosphate-grown DNA, a difference that is certainly not explained by its very low arsenic content.)

(Might they have not presented assays using properly purified (washed) DNA because these turned out to not have any arsenic?  Am I just paranoid?)

Finally, the authors examined the chemical environment (neighbouring atoms and bonds) of the arsenic in the cells using synchrotron X-ray studies.  This is over my head, but they seem to be trying to interpret the signal as indicating that the environment of the arsenic is similar to that of phosphorus in normal DNA.  But the cellular arsenic being in DNA can't be the explanation, because their DNA analysis indicated that very little of the cellular arsenic purifies with the DNA.  The cells contained 0.19% arsenic (1.9x10^6 ppb), but the DNA only contained 27 ppb arsenic.

Bottom line:  Lots of flim-flam, but very little reliable information.  The mass spec measurements may be very well done (I lack expertise here), but their value is severely compromised by the poor quality of the inputs.  If this data was presented by a PhD student at their committee meeting, I'd send them back to the bench to do more cleanup and controls.

There's a difference between controls done to genuinely test your hypothesis and those done when you just want to show that your hypothesis is true.  The authors have done some of the latter, but not the former.  They should have mixed pregrown E. coli or other cells with the arsenate supplemented medium and then done the same purifications.  They should have thoroughly washed their DNA preps (a column cleanup is ridiculously easy), and maybe incubated it with phosphate buffer to displace any associated arsenate before doing the elemental analysis.  They should have mixed E. coli DNA with arsenate and then gel-purified it.  They should have tested whether their arsenic-containing DNA could be used as a template by normal DNA polymerases.  They should have noticed all the discrepancies in their data and done experiments to find the causes.

I don't know whether the authors are just bad scientists or whether they're unscrupulously pushing NASA's 'There's life in outer space!' agenda.  I hesitate to blame the reviewers, as their objections are likely to have been overruled by Science's editors in their eagerness to score such a high-impact publication.

Planning a transformation experiment

I've promised to transform our lab strain (Rd) with chromosomal DNA from another strain, and send the pooled transformants to another lab for analysis.  Here I need to plan what I'll do.

Because most of the cells in our competent-cell props aren't actually competent, I'm going to transform the cells with a mixture of the other strain's DNA and a short fragment carrying an antibiotic resistance allele.  By selecting for this allele I'll make sure that all the cells I send actually did take up DNA.

I have two fragments I can use; both are about 2.5 kb long, produced by PCR from genomic DNA (the postdoc is making them for me right now).  One carries novobiocin resistance and the other carries nalidixic acid resistance.  I think I should use both, in separate transformations, as this will control for the slight possibility that the unmapped gene they're looking for is in the selected fragment.

How much of each DNA should I use?  I want a saturating amount of the chromosomal DNA, which I have already prepared; 1 µg in a 1 ml transformation should be fine. I should use a lot less of the fragment, because I want most of the DNA the cells take up to be chromosomal.  But I need to use a substantial amount, as I want to have at least thousands and preferably hundreds of thousands of transformants.  Transformation frequencies with pure fragments are typically high, with saturation reached at about 20 ng (I think).  If the transformantion frequency with this fragment was 1%, I would expect to get about 10^7 transformants from 1 ml (10^9) cells, so using 1-10 ng of fragment DNA should be lots.

I can do several controls to check how much of the chromosomal DNA the antibiotic-resistant transformants had taken up.  The chromosomal DNA carries a kanamycin cassette, so the best control will be to select for KanR NovR and KanR NalR double transformants.  The frequency with which the NovR or NalR cells carry KanR is an estimate of the fraction of cells that carry any particular donor segment.  It's an underestimate for SNP alleles (with homologs in both strains), and a good estimate for the efficiency of transformation of heterologous genes flanked by homologous segments.

Other controls that might not be worth the trouble: 
  • Transforming cells with both PCR fragments would give another estimate of SNP transformation frequencies.  
  • Transformations that contain only the PCR fragment would tell me how efficiently the chromosomal DNA is competing with the fragment for uptake.  I think that more competition means that the transformants will contain more segments of the other strain's DNA.
I'm going to plate the transformation mixtures so that, after colonies have grown up, I can pool the colonies by resuspending all the cells on the plate.  How should I plate the cells?  I'd like to be able to pool 10^4 - 10^5 colonies, so in addition to plating dilutions of 10^-3 and 10^-4 I should plate less dilute samples so I'll have plates with thousands and tens of thousands of colonies.  And I should put these on large (= normal-size) petri dishes rather than the little ones we usually use.

Once I've resususpended the colonies I'll check the OD600 to estimate the cell density, dilute them down to OD600 = ~0.3 (~10^9 cfu/ml), and add glycerol and freeze multiple aliquots at -80 °C.  I'll also plate dilutions to check the cfu/ml.  I might as well also plate on kanamycin plates, to confirm that these cells do carry the expected segments of chromosomal DNA.  If Everything checks out then on Monday I'll just pack the frozen cells in dry ice and ship them out.

Serum resistance

Last week I visited the hospital-based lab of a colleague in the UK.  One of the Haemophilus influenzae strains they're studying is resistant to killing by serum, and they wondered if our new genome-wide trait mapping project might be used to map the gene or genes responsible for this resistance.  I've never thought about serum resistance before, and here's what I've now found out.

In this context, 'serum' means 'blood serum', the component of blood that remains as a clear liquid after clotting has removed the cells (red blood cells and white cells and platelets) and the clotting-factor proteins.  It retains all the small molecules (sugars, salts, etc.), the lipids, all the antibodies and many other proteins. 

Body surfaces are typically tightly sealed to prevent surface bacteria from accessing the nutrient-rich tissues and the bloodstream.  Nevertheless, bacteria frequently enter the bloodstream because a surface barrier is accidentally broken (e.g. by dental treatments and even just brushing your teeth), because local disease has weakened the surface (e.g. in pneumonia) and because certain bacteria produce proteins that actively damage the barrier. 

Various components of serum (and of blood) kill bacteria that enter the bloodstream. Foremost are probably the complement proteins, acting with or without the help of antibacterial antibodies.  In general, bacteria that cause 'systemic disease' (disease that spreads through the bloodstream) are resistant to this killing; here's a review article from 1984.  One major contributor to the serum resistance of these 'invasive' bacteria is the presence of a cell-surface capsule - a layer of polysaccharide that protects the cell from attack by complement. 

Most capsulated strains of H. influenzae are serum resistant, particularly the serotype b strains that cause meningitis, and nonencapsulated strains are typically sensitive to killing by serum.  However the serum-resistant strain my colleague is interested in has no capsule, so its resistance must be due to some other property.

Identifying the gene or genes responsible for this strain's resistance will be easier if the resistance phenotype is strong enough to be cleanly selected for.  I've just searched for papers describing serum resistance in H. influenzae.  A paper from Arnold Smith's group is encouraging.  They were characterizing the complement resistance of a nonencapsulated but invasive strain R2866, and this graph shows the survival of it and control strains in normal human serum (diluted 50% in buffer+gelatin).  The triangles are a typical encapsulated strain (Eagan); its viability is unchanged after 45 minutes in serum.  The Xs are the nonencapsulated lab strain Rd; none of its original 10^8 cells survive 15 minutes in serum.  The squares are the  strain R2866; it's as serum resistant as Eagan.

If my colleague's strain is as serum resistant as R2866 we should have no trouble selecting for Rd transformants that have acquired the resistance.  We might succeed even if the recombination is inefficient because the Rd genome doesn't have a homolog of the responsible gene or if more than one gene is needed to give full resistance.

What I've been doing

Nothing that has generated any big insights.  The RA and I are working on the E. coli competence question:  Given that E. coli appears to have all the genes needed for DNA uptake and transformation, can we detect competence or transformation?  We have several strategies:  1.  Artificially induce sxy expression to turn on the competence genes, using one of two IPTG-inducible sxy plasmid constructs.  2. Use a recombineering protein to increase the efficiency of recombination.  3.  Screen strains of the ECOR collection.

How Vibrio cholerae regulates its competence

I've been working through the data on regulation of competence in Vibrio cholerae.  V. cholerae has most of the same competence genes as H. influenzae, and some of these have been shown to be needed for competence (especially the type IV pilin system and the inner membrane transport protein (Rec2 homolog).  Most of these genes are controlled by promoters with sequences resembling the Sxy-dependent CRP-S sites we have characterized in H. influenzae.  Sxy is known to be needed for competence development, as is the complex carbohydrate chitin.

Chitin is a polymer of N-acetyl-glucosamine (GlcNac) subunits, and is the main component of the exoskeletons of most arthropods, including the marine crustaceans that V. cholerae forms biofilms on.  Because V. cholerae can break down and metabolize chitin, this is thought to be a major nutrient source in biofilms.  So how does chitin availability regulate competence?  Does it regulate sxy?  Does anything else regulate sxy

A recent paper by Yamamoto et al. (Gene 457:42-49, 2010) investigated transcriptional and translational control of sxy expression in V. cholerae, and I've spent the afternoon coming to grips with what they did and what they concluded.  First they showed that the GlcNac dimer induces competence but the monomer does not.  But the transformation frequencies are very low by H. influenzae standards, 1.4x10^-8 and 4.4x10⁻⁸ for two different wildtype strains, 14-fold and 44-fold above the detection limit of 10^-9.  Transformation frequencies were 70 and 136-fold higher with a GlcNac tetramer.  Perhaps because of the result in the next paragraph, the authors concluded that the activator was the GlcNac dimer, not the tetramer, and used this for the rest of their experiments.

Expression of a transcriptional fusion to lacZ was induced about 2-fold by both the dimer and the tetramer of GlcNac (2.1x and 2.3x), but expression of a translational fusion was induced 25- and 34-fold.   This tells us that chitin's main contribution to the induction of competence is by increasing the translation of sxy mRNA.    The GlcNac tetramer wasn't much more effective than the dimer - the difference between its effect on sxy and on competence may mean that it independently regulates another component of competence.

They also mapped the start site of sxy transcription to 104 nt upstream of the GTG start codon (so the V. cholerae sxy mRNA has a long untranslated leader like the H. influenzae and E. coli sxy mRNAs.), They identified various candidate regulatory elements: the -35 and -10 elemments of the promoter, the Shine Dalgarno sequence beside the start codon, and several inverted repeats that they hypothesized had regulatory roles.

They next analyzed a large set of transcriptional and translational fusions of parts of the sxy gene to lacZ.  These showed the following:

First, removing the candidate sxy promoter eliminated expression, and replacing it promoter with a Ptac promoter increased expression of all fusions about 10-fold.  This tells us that they have correctly identified the sxy promoter, and that it is relatively weak or not fully induced under the conditions used.

With the sxy promoter and the transcriptional fusion, the GlcNac dimer increased expression only 2-fold, but with the translational fusion the dimer increased expression 25-fold.  With the Ptac promoter the effects were 0.9-fold and 30-fold.  These effects again tell us that chitin's effect is mainly on translation.  Nevertheless the authors concluded that chitin dimers act at the promoter to regulate sxy transcription.  I think this conclusion is not justified by the small effect seen only with one fusion.

Deletion of only the second inverted repeat had no effect on either kind of fusion.  But deletions between this and the third inverted repeat dramatically increased translation in the absence of GlcNac dimers (making translation constitutive), and deletions of coding sequences downstream of the dimer had the opposite effect, eliminating translation entirely.

In their inspection of the sxy sequence for candidate regulatory elements, the authors overlooked a very strong potential CRP-N site 50 nt upstream of the promoter.  This suggests that V. cholerae sxy transcription may regulated by CRP/cAMP and thus by the phosphotransferase carbohydrate-utilization system (the PTS).  The H. influenzae sxy gene is also regulated by CRP and the PTS, and the E. coli gene has a partial CRP site whose role hasn't been tested yet.

Bottom line:  Transcription of V. cholerae sxy is likely regulated by CRP, and translation is tightly regulated by chitin dimers.  Chitin tetramers may separately regulate another compoonent of competence.  As in E. coli and H. influenzae, CRP activation is likely a signal of nutritional stress (that preferred sugar sources are unavailable).  Regulation of competence by chitin may have evolved because of its role as a nutrient , but it may also signal that the cell is in a biofilm, where DNA is usually abundant.

What we need to find out about E. coli's competence regulon

The RA and I have summarized our various results about the E. coli CRP-S regulon and its competence  (or lack of competence).

Although we (she, really) have done a lot of work, we still have no experimental evidence that the E. coli sxy gene is inducible at all.  And we have no evidence that artificial induction of sxy causes competence.  We need something positive for our paper, otherwise it's just a string of negative results that's not nearly comprehensive enough to warrant publication.

The only sxy-dependent phenotypes we have are (1) a pseudo-natural plasmid transformation, where the sxy+ frequency of 9x10⁻⁸ is reduced to less than 2x10⁻⁹ in sxy- cells, and (2) competitive fitness in long-term co-culture, where a sxy- mutant is outcompeted by a sxy+ strain (~10-fold difference in cfu after 6 days, ~100-fold difference after 15 days).  Palchevskiy and Finkel have shown that Sxy-induced genes are needed for cells to use DNA as a nutrient, but we haven't been able to replicate this.  And we have shown that artificial induction of sxy induces all of the genes in the CRP-S regulon, and that the pilin protein encoded by one of these, ppdD, is translated and correctly processed.

The strong conservation of the CRP-S regulon (including sxy) and the very strong parallels to the H. influenzae competence regulon justify our hypothesis that sxy expression is inducible, and that this induction causes E. coli cells to take up DNA from its environment.  To make progress we need at least partial answers to these questions:

Question 1:  What factors induce E. coli sxy expression?  Another lab has already done extensive testing of culture conditions, assaying for pilin expression from ppdD, but found no induction.  I've also tested some conditions for induction of other Sxy-regulated gene fusions, and the RA and former postdoc tested growth-condition dependence using quantitative PCR of sxy itself, again with no good evidence of induction. What we need to do now is to bring our molecular expertise to bear on this question.

We expect to find that E. coli sxy has both transcriptional and translational regulation, because such dual regulation has been demonstrated in both H. influenzae and V. cholerae, and because its transcript has a long untranslated leader (116 nt) like these species.  Transcription may be regulated by CRP and cAMP, because the sxy promoter has a partial CRP site.  This site looks like a reversed E. coli CRP-S site rather than like a CRP-N site, which might mean that sxy transcription is autoregulated by Sxy itself.  Because the site is inverted relative to the sites found in the CRP-S promoters identified by our microarray analysis, this autoregulation may be negative (high Sxy may cause reduced transcription).  We haven't yet directly tested either cAMP/CRP or Sxy for direct effects on sxy transcription.   We can't do this with either of of our sxy-expression plasmids, because neither has an intact sxy promoter, but we could test wildtype cells for altered expression of the chromosomal sxy gene.  We could also test whether cells with an internal insertion/deletion in sxy (but an intact promoter and 5' end) have more or less sxy transcript.  Unfortunately we still don't have a Sxy antibody so we can't test for protein.


Question 2:  Does Sxy induce competence?  So far we have not found any evidence of genetic transformation in cells artificially induced to express moderate levels of Sxy.  This could be because Sxy doesn't induce DNA uptake in E. coli, but it could also be because the level of Sxy is too low, or because the cells take up DNA but don't recombine it, or because Sxy doesn't induce DNA uptake in the K-12 strain but does in other strains.


The Sxy expression level we tested was low enough that it didn't interfere at all with growth.  This was fully-induced expression from a low copy number plasmid with an IPTG-inducible lac promoter.  The higher expression level we've used (for the microarray analysis) was very toxic and we couldn't test for transformation at all. 
We can clarify some of these alternative.  We can measure DNA uptake directly using radiolabelled DNA. In principle this is not nearly as sensitive as measuring transformation, but that's only true if transformation is very efficient.  So maybe Sxy expression is making E. coli competent, and it's taking up lots of DNA, but just not producing any transformants.

We can also measure sxy transcript levels in cells artificially induced to different extents, and use this information to decide which conditions we should use to examine DNA uptake.  The high copy plasmid gives massive induction and toxicity, and lower concentrations of the inducer still reduce the growth rate quite a bit.  The low copy plasmid doesn't reduce the growth rate at all.  I think we should examine an intermediate level, using a low concentration of inducer with the high copy plasmid.  And we should add cAMP to these cultures as well as inducer - cAMP isn't needed for sxy induction from the plasmid but it may help with expression of some or all of the CRP-S genes.

There are lots of other E. coli strains we could test in addition to K-12.  The RA has already screened the entire ECOR collection (~70 strains) for the level pilin expression in overnight cultures.  She found no detectable expression in any strain.  It would be good to test at least one strain more thoroughly, for transformation and DNA uptake, but how to decide which strain(s) to test?

Cyclic-di-GMP might regualte competence in E. coli, but not by a riboswitch

I sat down with the RA yesterday, planning to look for riboswitches in her E. coli sxy mRNA sequence.  But a couple of discoveries made this unnecessary.

First, she reminded me that Vibrio cholerae has two sxy homologs, not just one, and we quickly realized that the c-di-GMP ('GEMM') riboswitch is in the one that isn't known to have anything to do with competence. 

We also checked the supplementary files for the paper that characterized this riboswitch, and discovered that the authors had done a very extensive search for GEMM riboswitches, not just in all the published bacterial genomes but in all microbial genomes and in a wide assortment of environmental genomics datasets.  They found no GEMM riboswitches in any Pasteurellaceae; this isn't surprising because there's no evidence of c-di-GMP in this family.  But they also found no GEMM riboswitches in any of the Enterobacteraceae. 

So we decided that E. coli is very unlikely to regulate its sxy gene by a GEMM riboswitch.

Should I review for a "Frontiers in" journal?

I've received a review request for a manuscript submitted to  Frontiers in Antimicrobials, Resistance and Chemotherapy.  The manuscript is in my area so normally I'd just say OK, but there are a lot of weird things about this 'journal'.

I put 'journal' in quotes because this appears to be one of many nascent efforts of the Frontiers online publishing group.  Their home page has headings for 'Science' (7 Fields with a total of 117 Specialty journals, including the one that has contacted me for a review), Medicine (3 Fields, 58 Specialty journals) and Technology, Society and Culture, each with no Fields and no Specialty journals.  Each Specialty Journal has an Editor and a panel of Associate Editors.

These are the same people who keep spamming us with Frontiers in Neuroscience notifications.

The review process described on the Review Guidelines pages is novel and very open.  All submitted manuscripts are sent out for review after a simple filtering by the Editor to eliminate obvious junk.  As soon as the reviewers have submitted their reviews the manuscript's Abstract is posted under a 'Paper Pending' heading and the manuscript and the reviews are placed in an Interactive Review Forum, where the (still anonymous) reviewers and the authors are supposed to discuss the manuscript (I think the Editor/Associate Editors can join in here).  Eventually an agreement is reached on revisions.  The authors then submit the final manuscript which is formatted and published online, along with the names of the reviewers.  If no agreement can be reached the Editor may overrule the reviewers, or the paper may be withdrawn by the authors or rejected by the Editors

Most of the specialty journals have published no original research articles and few or no opinion/review articles.  Many of the journal web pages look like they may just be  place-holders.  I chose one Microbiology journal at random - it has an Editor and 19 Associate Editors, but has published only one paper (an Opinion piece by the Editor) and has one original research Paper Pending.

I clicked on what I thought would be another information page about the reviewing process, and instead found myself with a 15-page pdf of instructions for budding journal editors in the Frontiers system.   It's like a pyramid scheme, with the instructions explicitly recommending that the editors build their prestige by recruiting Associate Editors and soliciting authors and articles.  This is how the Frontiers enterprise makes its money, by charging authors more to publish their papers.  Because much of the work on the individual papers is done by unpaid editors and reviewers, the more papers Frontiers publishes the more money they make.  No wonder they have so many 'journals'.

Nevertheless I think that, as an advocate of new forms of scientific communication, I should give this a try.  I hope it's not too time-consuming.

LATER:  Well, the paper was bad.  Really really bad.  Luckily it was also very short.  And did you know that, if your institution subscribes to Turnitin, you can use this service to find evidence of plagiarism in manuscripts as well as in student submissions?

Might cyclic-di-GMP regulate competence?

I've (at last) gotten back into working on our review article about the regulation of competence.  This morning I was reading about competence regulation in Vibrio, and found out that that the 5'-end of the sxy (tfoX) mRNA has a riboswitch secondary structure that responds to cyclic-di-GMP (a 'GEMM' riboswitch).

The H. influenzae sxy mRNA has a long untranslated 5' leader whose secondary structure limits translation - might this be because it's also a GEMM riboswitch?  A few years ago we checked it for similarities to the then-known riboswitches, and it didn't fit the pattern at all.  But I found a useful genome-survey paper by Michael Galperin which found that H. influenzae (and the other sequenced Pasteurellaceae) have no homologs of the proteins that synthesize and break down c-di-GMP.  So they're very unlikely to have any riboswitches that recognize this molecule.

However there are several reasons to suspect that c-di-GMP might regulate sxy expression and competence in E. coli.  Like Vibrio speciess, E. coli strains have multiple proteins predicted to synthesize c-di-GMP.  E. coli sxy mRNA also has a long leader.  In many bacteria, increased levels of  c-di-GMP repress flagellar genes, as does sxy overexpression in E. coli.

In principle we could check for regulatory effects by adding c-di-GMP to cultures of E. coli (or H. influenzae) and look for changes in expression of sxy or of genes it regulates. BUT, very few of the papers I've been reading today did this.  Instead the researchers went to a lot of work to genetically engineer cells to produce abnormally high or low levels of c-di-GMP, which makes my suspect that cells may not be permeable to c-di-GMP.  Even the few papers that did add it to cultures didn't directly measure changes in gene expression, but just described phenotypic changes such as alterations in biofilm formation.  But the papers don't come out and say that exogenous c-di-GMP can (or can't) enter cells.  Perhaps I should email some authors about this.

I also should check the E. coli sxy mRNA leader sequence to see if it has the properties expected of a GEMM riboswitch.  The RA, always ahead of the game, has already gone to a lot of effort to map the 5' end of this mRNA, so we can sit down with the sequence tomorrow. 

Investigating E. coli's 'competence' regulon

This morning the RA and I discussed our immediate research goals.  We agreed that it's time to pull together all the work we've done on competence in E. coli, and see what more we need to make a good paper.  Although we don't know anything about the properties of competent E. coli (because we have not been able to make E. coli detectably competent), we have accumulated quite a lot of relevant information, and we think that even a negative result paper could be worthwhile.

The basic situation is that E. coli has apparently intact homologs of all of the genes H. influenzae needs to become competent, and all of these are induced when the Sxy activator is overexpressed.  One of these genes, ppdD, has received attention from other labs, because it encodes a type IV pilin that appears to be functional (it can be assembled into pili by Pseudomonas aeruginosa), but these labs haven't been able to turn the gene on in E. coli.

The cost of fertility selection

One component of the reombination hotspot model presented on Friday was fertility selection.  If hotspots are not present to cause crossovers between homologous chromosomes at meiosis, the chromosomes segregate randomly into the two daughter cells, so that half of the time one cell gets both homologs and the other gets neither, creating a defective gamete.  This 50% reduction in fertility creates very strong selection for active hotspots

In our original model, this selection acted directly on the hotspot alleles, but wasn't quite strong enough to preserve the active alleles in the face of their self-destructive mode of action (Boulton et al, 1997, Pineda-Krch and Redfield 2005).  In the new model presented at the seminar, this selection instead acts on a modifier locus which determines which hotspot alleles are active.  The hotspot alleles undergo mutation that changes their sequence, and mutations at the modifier locus change its specificity so that formerly inactive hotspot alleles sometimes become active.  If this occurs when the previously active hotspot has self-destructively converted itself into an inactive allele that's now activated by the mutant modifier, this creates fertility selection for the new modifier allele.

This model is supported by the recent discovery that the activity of real hotspots is modified by another locus, PRDM9 (Drive Against Hotspot Motifs in Primates Implicates the PRDM9 Gene in Meiotic Recombination.)  This gene was first identified because the alleles present in different species of mice cause infertility in hybrids, and this is now thought to occur because of failure to recognize the other species' hotspot alleles at meiosis.  The PRDM9 locus does evolve rapidly, especially at certain amino acids in its DNA-binding zinc-finger repeats (Accelerated evolution of the Prdm9 speciation gene across diverse metazoan taxa).

The model presented on Friday was able to reproduce the key features of hotspot evolution - rapid turnover of individual hotspots (replacement of active alleles by inactive ones) and preservation of a reasonable recombination rate.  (But I can't remember how high this recombination rate was...).  But it depended on fertility selection acting on the modifier.

In the talk I raised one issue that I think is very important, the strength of fertility selection, but I'm not sure how coherently I explained it. Many models of natural selection incorporate a step that restores the population size in each generation, after selection has removed some individuals.  In a deterministic model this can be done simply by normalizing the numbers, but in a model that follows individuals stochastically, new individuals must be added to the population in each generation to replace those that have died or failed to reproduce.  This implicitly assumes that population size is not limited by selection.  This is a dangerous assumption because it eliminates the risk that the population will go extinct if selection is too severe.  In most models this is only a theoretical concern, because selection is relatively weak. We usually think of strong selection as a positive force for evolutionary change, but it can also be a negative force causing extinction.  In fact, extinction might be the usual outcome, with only those lucky populations that happen to have the right alleles escaping it.

Models of hotspot-dependent recombination can incorporate very severe selection, as we discussed in our two hotspot papers.  If even a single chromosome loses enough active hotspots that it usually has no crossovers, the population's fertility will be reduced by 50%; if several chromosomes have this problem, fertility will be so low that extinction becomes likely. 

Two aspects of the model presented on Friday raised red flags about the strength of fitness selection.  First, the modifier locus was assigned a very high rate of mutations that changed its sequence specificity (I think 10^-2 per generation), but never suffered mutations that reduced its activity.  This is very unrealistic; everything we know about gene function predicts that loss-of-function mutations will be much more common than change-of-specificity mutations, and nothing about the PRDM9 gene suggests that it should be exempt from this principle.  Loss-of-function mutations at the modifier locus would be expected to cause sterility, as is well established for PRDM9.   Second, only a single chromosome was modeled, but I think the fertility cost will increase dramatically (exponentially?) as the number of chromosomes increases.

I still think the model is very important, because it incorporates the same features implicated by the PRDM9 work.  But it won't be realistic until it considers the real cost of the fertility selection it depends on.  It should be easy to modify the model to monitor the fraction of the population that fails to reproduce in each generation.  If this fraction is substantial (I'm being deliberately vague here because I don't know how large would be too large), then introduction of a modifier locus hasn't really resolved the paradox.

Fed up

Yesterday morning was very stimulating - conversation with and seminar by Francisco Ubeda, a visiting theoretician whose focus on the evolution of intra-genomic conflict led him to a very nice model of the evolution of recombination hotspots.  The seminar's audience was great too.  I'm going to try to make a stop-motion animation of his model, but first I have to model eukaryotic chromosome replication, then mitosis, then meiosis, then crossing over, then initiation of crossing-over by double-strand break repair, then the role of hotspots in initiation, and then the hotspot conversion paradox.  At that point I can make a model that incorporates a trans-acting sequence-specific modifier of hotspot activity.  This may take some time....

But yesterday afternoon was very frustrating.  I had brought my new batch of DNA-coated polystyrene beads to the optical tweezers apparatus, in the hope of testing whether competent cells would bind to them.  But I never got to try this, because it was so difficult to get the tweezers to hold on to a bead.  Almost every bead that got close to the laser focus was drawn in to it and then immediately spit out again (probably drawn in one side and out the other (the beads appeared to pop through the trap, rather than sticking at its focus).  I halfway remember my biophysicist colleague telling me that the bead should approach the focus point from the front side, but I had no way of telling whether an out-of-focus bead was in front of the focus or behind it.

First I tried a chamber with B. subtilis cells and beads, then a chamber with beads but no cells.  The beads were sufficiently sparse that finding ones to try to trap was inefficient, so I concentrated my bead stock and filled a fresh chamber.  This only resulted in lots more beads popping through the trap.

The plane of focus is both the focus of the visible light that illuminates the image and of the laser that traps the bead.  I'd been advised that trapping worked best when this plane was about 5 µ behind the coverslip surface (the top of the chamber), so I tried to maintain this position.  It wasn't always at exactly the same setting on the micrometer that controls the focus position, because of minor variations in the thickness of the parafilm sheets that form the sides of the chamber.  When I didn't have cells attached to the coverslip, I could still check this position once I had trapped a bead, by bringing the focus forward to a position where the coverslip pushed the bead back out  of the trap (the laser focus point).

But even with the focus perfectly positioned, only very few beads stayed in the trap for even a few seconds.  My colleague suggested trying 3 µ beads (mine were 2.1 µ) as she's had consistent success with them.  But I couldn't get them to work much better than mine.  Eventually I gave up.  I think it may be time to set this whole project aside until we find a graduate student to take it on.

We're doing genomics

I needed to write a short paragraph describing how our research area fits with UBC's new program in Genome Science and Technology (GSAT).  Here it is:

My research group uses genomic technology to investigate the different ways that recombination shapes bacterial genomes, focusing on the natural transformation system of Haemophilus influenzae and using DNA sequencing as an experimental tool to identify the causes and consequences of DNA uptake and recombination.  One project aims to fully characterize the recombination tracts produced when cells of one strain take up DNA from another, using Illumina sequencing of many independent recombinant genomes.  A second project uses these recombinant sequences in genome-wide searches for the loci responsible for the differing abilities of natural bacterial strains to be transformed.  A third project is characterizing the sequence specificity of DNA uptake by applying deep sequencing to DNA fragments that have been preferentially taken up by competent cells.  Finally, we are using optical tweezers technology to physically characterize the process of DNA uptake by naturally competent cells.

Beads densely coated with DNA!

So yesterday I incubated some streptavidin-coated polystyrene beads (2.1 µ diameter) with some biotin-tagged EcoRI-cut H. influenzae DNA.  How many beads?  About 3.5 x 10^8.  How much DNA? About 2 µg.  The mixture was incubated at 37 °C for about 4 hr, first undiluted and then diluted to 50 ml in TE buffer.  I washed the unbound DNA off the beads by drawing the mixture through a filter with 0.2 µ pores; I expected this to retain the beads but allow the unbound DNA to pass through.  I washed the filter by drawing 25 ml of TE buffer through it, five times.  This was a slightly less thorough series of washes than it sounds, because I tried not to always leave a little bit of buffer on the filter, worrying that if it was sucked dry the beads might be difficult to recover.  But I didn't always succeed so the washes were pretty thorough.  The thoroughness of the washes becomes important below.

I put the filter into a tube with a ml of THE and agitated it a lot to resuspend as many of the beads as possible.  I then used the hemocytometer to count the resuspended beads and a comparable input bead suspension.   This showed that I'd recovered more than 90% of the beads.  Then I used Picogreen to measure the amount of DNA in the bead suspension: 330 ng/ml.  This let me calculate how much DNA was on each bead: about 1000 kb!  The average fragment size of EcoRI-cut H. influenzae DNA is about 3-4 kb, so this is about 300 DNA fragments per bead.

I was initially quite pleased with this result, but then started worrying that this was to high to be true.  Is there even room on a 2.1 µ bead for this many fragments?  And 1000 kb is more than half a H. influenzae genome. I rechecked my calculations, and they all seemed correct.  I had never tested whether the filter-washing procedure worked as I thought it should - might much of the DNA have been trapped on the filter rather than being wwashed away, and might it then have been resuspended along with the beads?  If so, most of the DNA in my washed beads prep might not be bound to the beads

So this morning I pelletted the beads, removing all but ~20 µl of the supernatant before resuspending them in another ml of TE, and did Picogreen assays on both the bead-free supernatant and the resuspended beads.  This showed that about 75% of the DNA was indeed on the beads.  This means I have lots of beads with lots of DNA on them, ready for many tweezers experiments.

Yesterday I also used the washed beads to transform competent cells.  Preliminary colony counts (the plates need longer incubation) suggest that the transformation frequency was very low (about 10^-7), much lower than expected for the presumed DNA concentration of ~100 ng/ml.  This is consistent with much of the DNA being inaccessible to the cells.    (But I should go back and check a control transformation I did in another experiment, in case the EcrRI-cut DNA always transforms poorly*.)

*  Indeed, EcoRI cuts within the gyrB (NovR) gene, and even when the DNA was not bound to beads the transformation frequency was only 1.3 x 10^7.

Back to the bench (sans camera)

I'll be going to the university across town on Friday, partly to hear an informal talk about the evolution of recombination hotspots (a problem we pioneered) and partly to try to get cells to attach to DNA-coated beads using the optical tweezers.

I haven't done anything with the tweezers since before we submitted our latest CIHR grant proposal (Beads and cells).  That attempt used beads that had been incubated with DNA and thoroughly washed, but I hadn't taken the time to check how much (if any) DNA was actually bound to the beads.  This time I want to be sure that there's DNA on the beads, so after I wash them I'll use Picogreen to measure the bound DNA.

So I'll first incubate the streptavidin-coated polystyrene beads (2.1 µm diameter) with biotin-tagged chromosomal DNA (how much?) for a couple of hours, inverting the mixture on the roller wheel to keep the beads from clumping.  Then I'll dilute the beads and wash them by trapping them on a 0.2 µm filter, pouring lots of TE through them.  Then I'll resuspend the beads in a small volume of TE and measure the DNA concentration.  Maybe I'll also use the beads in a transformation assay to check that DNA is present and the cells can take it up.

Hidden Markov Models for dummies?

The postdoc just gave me a copy of a short article by Sean Eddy titled "What is a hidden Markov model" (Nature Biotechnology 22: 315-316).  It's only two pages long, and the heading "Primer" flags it as something for beginners.  But I'm struggling to understand it, even with help from the postdoc.  So this post will probably be a mix of attempts to explain what a hidden Markov model (HMM) is and does, and complaints that Eddy has failed to weed out much of the jargon from his explanation.

Below I've pasted the figure he uses to illustrate his explanation.  We assume that we have a short DNA sequence sequence (look in the middle of the figure, below the arrows), and we want to infer which of the bases in it are exon, 5' splice site, or intron.  Because we're told that the sequence starts as exon and contains only one 5' splice site, the only decision we need to make is the location of this splice site.

I think this is how an HMM would do this.  It independently considers all of the possible functions for every position, assigns them probabilities (based on the base it finds in the given sequence at that position), and then picks the combination of functions with the best probability score.  Because there are 24 bases and 3 possible functions for each, there are (I think) 3^24 different combinations to be considered.  Fortunately many of these never arise because of several constraints that the model has been given.  First, only Gs and As can be 5' splice sites, as shown in the base-probabilities given at the top of the figure.  Second, there can be only one splice site.  Third the 'exon' function ('E') can only occur before the splice site ('5'), and the 'intron' function ('I') can only occur after it.  This last constraint is indicated by the horizontal and circular arrows that connect these symbols (below the base probabilities); these specify how the state of one position affects the probabilities associated with states at the next position.

After describing the figure Eddy says 'It's useful to imagine a HMM generating a sequence', but I don't think this is what he means.  Or rather, I suppose that he's using the words 'generating' and 'sequence' in some special sense that he hasn't told the reader about.  By 'sequence' he doesn't seem to mean the sequence of bases we were given.  Maybe he means one of the many possible combinations of functions the model will assign to these bases for the purpose of calculating the combination's probability, given the set of constraints the model is using. 

He then says 'When we visit a state, we emit a residue from the state's emission probability distribution.'  OK, he did define the 'emission probability distribution' - it's the base probabilities at the top of the figure.  But what can he mean by 'visit a state' and 'emit a residue'?  The postdoc says that 'emit' is jargon that roughly means 'report'.  But we already know the residues - they're the bases of the sequence specified in the figure.  Maybe the HMM is moving along the 24 positions, and at each position it 'visits' it asks what the base is ('emits a residue').  It then considers the probabilities of all three potential states, given both the state assigned to the previous position and the probabilities of finding that specific base given the state it's considering.

Maybe this will make more sense if I consider starting at the 5' end of the sequence and applying the model...

OK, start at position 1.  What states might it have, and with what probabilities?  According to the transition probability arrows, it will have state E with probability 1.0, so we don't need to consider any influence of which base is present at this position (it's a C).  What about the next base (position 2)?  The arrows tell us that there's a 0.1 chance of a transition to state 5, and a 0.9 chance of this position  being in state E like position 2.  The position has base T, which means it can't have state 5 and so must be state E.  The same logic applies to positions 3 and 4 (T and C respectively).

Position 5 has base A, so now we start to consider the first branching of alternatives strings of state assignments, one where position 5 has state E (call this branch A) and one where it has state 5 (call this branch B).  What are the probabilities of these two branches?  To get the probability of the state 5 alternative I guess we multiply the 0.1 probability of a state transition by the 0.05 probability that a state 5 position will have base A.  So the probability of the state 5 branch is only 0.005, which must mean that the probability of the state E branch is 0.995.

Position 6  has base T.  In branch B, this position must have state I, because it follows a state 5 position.  All the bases after this must also be state I, so the total probability of the splice site being at position 5 is 0.005.  In branch A, position 5 must be state E

Position 7 has base G, so we must calculate the probability that it is the splice site as we did for position 5.  We multiply the probability of the transition (0.1) by the probability that a G is the splice site (0.95), giving a branch probability of 0.095 (call this branch C).  But we need to take into account the probability of branch A that we already calculated (0.995), so the total probability of branch C is 0.095 x 0.995 = 0.094525  The other branch can still be called branch A; it has probability 0.995 x 0.905 = 0.900475.  [Quick check - the probabilities so far sum to 1.0 as they should.]

Position 8 is a T; in branch A it must have state E.  Position 9 is another G...   OK, I see where this is going.  I think this example might be a bit too simple because only one branch continues (we don't have to calculate probabilities for multiple simultaneously ramifying branches.  There are only 14 possilbe combinations of states, one for each of the As and Gs in the sequence, because only these are potential splice sites.

Anyway...  Did this exercise help me understand what Eddy is trying to explain?  If what I've written above is correct, then yes, I guess I sort of understand the rest of the article (except for the sentences immediately following the ones I quoted above).  If what I've written is wrong, then, of course, no. 

In the next paragraph he explains why this is called a Markov chain (because each state depends only on the preceding state, and why it's 'hidden' (because we don't know the true states).  And the later paragraphs are mostly clearer, except for one place where he lapses back in to the jargon about residues being emitted by states.

He explains that the 'posterior decoding' columns at the bottom of the figure are the probabilities that each of the Gs is the true splice site.  But the probability I've calculated for position 7 (0.095) is larger than indicated by the corresponding column (about 0.03-0.04?), so I might have done something wrong in calculating the probability for this splice site.

Aha.  I've overlooked the different probabilities for the bases in the I state.  I think I have to modify the probability that positions 5 and 7 are splice sites by the probabilities that the bases that follow them are introns.  I shouldn't just calculate the probability that position 5 is a splice site from the position 4-to-5 transition probability and the position 5 emission probability for a splice site (p = .005), and then just assume that the following positions are intron sites.  Instead I need to modify the calculated probability of 0.005 by the probabilities associated with each of the following positions being in the intron state, according to their known base identities.

OK, I take back most of my initially harsh criticism of this article.  There's one big flaw in the middle, where he slips into technical jargon, using what appear to be simple English words ('emit', 'visit') with very specialized technical meanings that cannot be inferred from the context.  But otherwise it's good.

I've made a movie of DNA uptake!