


- Use the 'Significance' section to build the reader's interest in the problem(s) our Specific Aims address.
- Use the 'Innovation' section to build the reader's interest in the methods we will use to achieve our aims.
- Use the 'Approach' section to convince the reader that we can accomplish our Aims.
- Use the initial 'Specific Aims' page to summarize all of the above, both as an introduction for the few readers who will read the rest of the proposal and as a stand-alone summary for everyone else.
Field of Science
-
-
Change of address9 months ago in Variety of Life
-
Change of address9 months ago in Catalogue of Organisms
-
-
Earth Day: Pogo and our responsibility1 year ago in Doc Madhattan
PHS 398 gestalt
I've been trying to reorganize my initial NIH proposal outline, so it fits the new guidelines. Here's how I think I should be using the new format:
A paradigm shift for how I organize grant proposals?
Yesterday I put together a paragraph-by-paragraph outline for our NIH proposal, using the usual sensible order: One-page Summary, Introduction and Background, Specific Aims, Preliminary Results, Research Methods. Today NIH released the new official Instructions (new because they're reduced the page limit from 25 to 12, and streamlined the content). Here's the organization they want; I'm going to have to do a lot of rethinking to figure out where I should put the information I would normally present, what I should leave out, and what new issues I need to emphasize. Luckily I'm not the only person dealing with this change - everyone applying for the usual NIH RO1 grants has to now use this format:
Specific Aims
This comes first; it has a one-page limit. I think it must also serve as a Summary page, because I can't find any mention of a separate Summary in the Instructions.
(a) Significance
(b) Innovation
C. Approach
I promised myself that I'd have a rough draft by the end of November, so I'd better get busy converting my outline into paragraphs.
Specific Aims
This comes first; it has a one-page limit. I think it must also serve as a Summary page, because I can't find any mention of a separate Summary in the Instructions.
- State concisely the goals of the proposed research and summarize the expected outcome(s), including the impact that the results of the proposed research will exert on the research field(s) involved.
- List succinctly the specific objectives of the research proposed, e.g., to test a stated hypothesis, create a novel design, solve a specific problem, challenge an existing paradigm or clinical practice, address a critical barrier to progress in the field, or develop new technology.
(a) Significance
- Explain the importance of the problem or critical barrier to progress in the field that the proposed project addresses.
- Explain how the proposed project will improve scientific knowledge, technical capability, and/or clinical practice in one or more broad fields.
- Describe how the concepts, methods, technologies, treatments, services, or preventative interventions that drive this field will be changed if the proposed aims are achieved.
(b) Innovation
- Explain how the application challenges and seeks to shift current research or clinical practice paradigms.
- Describe any novel theoretical concepts, approaches or methodologies, instrumentation or intervention(s) to be developed or used, and any advantage over existing methodologies, instrumentation or intervention(s).
- Explain any refinements, improvements, or new applications of theoretical concepts, approaches or methodologies, instrumentation or interventions.
C. Approach
- Describe the overall strategy, methodology, and analyses to be used to accomplish the specific aims of the project. Include how the data will be collected, analyzed, and interpreted as well as any resource sharing plans as appropriate.
- Discuss potential problems, alternative strategies, and benchmarks for success anticipated to achieve the aims.
- If the project is in the early stages of development, describe any strategy to establish feasibility, and address the management of any high risk aspects of the proposed work.
- Discuss the PD/PI's preliminary studies, data, and/or experience pertinent to this application.
I promised myself that I'd have a rough draft by the end of November, so I'd better get busy converting my outline into paragraphs.
Improved trait mapping?
A few weeks ago I posted the first figure below to illustrate the logic of our planned experiment to map the locations of the alleles that cause some strains of Haemophilus influenzae to transform very poorly or not at all. (Sorry, that's not an easy sentence.) The sensitivity of that experiment isn't very good. Below I'll explain why and describe what I think may be a better approach. (And the RA just suggested another approach that sounds good, so I'll try to incorporate that one too.)
First a paragraph of background. Different strains of H. influenzae differ dramatically in how well they can take up DNA and recombine it into their chromosome (their 'transformability'). Transformation frequencies range from 10^-2 to less than 10^-8. We think that finding out why will help us understand the role of DNA uptake and transformation in H. influenzae biology, and how natural selection acts on these phenotypes. Many other kinds of bacteria show similar strain-to-strain variation in transformability, so this understanding will probably apply to all transformation. The first step is identifying the genetic differences responsible for the poor transformability, but that's not so easy to do, especially if there's more than one difference in any one strain.
Step 1: The first step we planned is to incubate competent cells of the highly transformable lab strain with DNA from the other strain we're using, which transforms 1000-10000 times more poorly. We can either just pool all the cells from the experiment, or first enrich the pool for competent cells by selecting those that have acquired an antibiotic resistance allele from that DNA. We expect the poor-transformability allele or alleles from the donor cells (call them tfo- alleles) to be present in a small fraction (maybe 2%?) of the cells in this pool.
Step 2: The original plan was to then make the pooled cells competent again, and transform them with a purified DNA fragment carrying a second antibiotic resistance allele. The cells that had acquired tfo- alleles would be underrepresented among (or even absent from) the new transformants, and, when we did mega-sequencing of the DNA from these pooled second transformants, the responsible alleles would be similarly underrepresented or absent.
 The problem with this plan is that it's not very sensitive. Unless we're quite lucky, detecting that specific alleles (or short segments centered on these alleles) are significantly underrepresented in the sequence will probably be quite difficult. The analysis would be much stronger if we could enrich for the alleles we want to identify, rather than depleting them. The two alternatives described below would do this.
Step 2*: First, instead of selecting in Step 2 for cells that can transform well, we might be able to screen individual colonies from Step 1 and pool those that transform badly. We have a way to do this - a single colony is sucked up into a pipette tip, briefly resuspended in medium containing antibiotic-resistant DNA, and then put on an antibiotic agar plate. Lab-strain colonies that transform normally usually give a small number of colonies, and those that transform poorly don't give any. Pooling all the colonies that give no transformants (or all the colonies that fall below some other cutoff) should dramatically enrich for the tfo- alleles, and greatly increase the sensitivity of the sequencing analysis. Instead of looking for alleles whose recombination frequency is lower than expected, we'll be looking for spikes, and we can increase the height of the spikes by increasing the stringency of our cutoff.
 The difficulty with this approach will be getting a high enough stringency for the cutoff. We don't want to do the work of carefully identifying the tfo- cells, we just want to enrich for them. In principle the numbers of colonies can be optimized by varying the DNA concentration and the number of cells plated, but these tests can be fussy because the transformation frequencies of colonies on plates are hard to control.
Step 1* (the RA's suggestion): Instead of transforming the lab strain with the poorly-transforming strain in Step 1, we could do the reverse, using DNA from the lab strain and competent cells from the poorly transformable strain. Step 2 would be unchanged; we would make the pooled transformants competent and transform them with a second antibiotic-resistance marker, selecting directly for cells that have acquired this marker. This would give us a pool of cells that have acquired the alleles that make the lab strain much more transformable, and again we would identify these as spikes in the recombination frequency.
 The biggest problem with this approach is that we would need to transform the poorly transformable strain. We know we can do this (it's not non-transformable), but we'd need to think carefully about the efficiency of the transformation and the confounding effect of false positives. If we include the initial selection described in Step 1, we could probably get a high enough frequency of tfo+ cells in the pool we use for step 2.
The other problem with this approach is that we'd need to first make the inverse recombination map (the 'inverse recombinome'?) for transformation of lab-strain DNA into the tfo- strain. This would take lots of sequencing, so it might be something we'd plan to defer until sequencing gets even cheaper.
I think we may want to present all of these approaches as alternatives, because we're proposing proof-of-concept work rather than the final answer. The first two are simpler and will work even on (best on?) strains that do not transform at all. The last will work very well on strains that do transform at a low frequency..
Still not done
The batch of runs in paragraph F in last night's post ran fast, but only because they were (incorrectly) set up to use a genome sequence that was only 20 kb. I forgot that they needed longer input sequences than the 20 kb of random sequence plus 100 uptake sequences I'd used for the other runs. So now I've created 50 kb, 100 kb and 200 kb versions, seeded with 250, 500 and 1000 uptake sequences respectively, and queue'd those runs.
One of the runs I thought to have hung has finished, and it gives me enough data to fix the graph I needed it for. But I'm not going to do any more work on this until my co-authors have ahd a chance to consider whether we want to include this figure (I like it).
One of the runs I thought to have hung has finished, and it gives me enough data to fix the graph I needed it for. But I'm not going to do any more work on this until my co-authors have ahd a chance to consider whether we want to include this figure (I like it).
Getting the US variation manuscript off my hands
Yesterday I gave up and sent the current version of our manuscript about uptake sequence variation off to my coauthors. I'm afraid I'd gotten caught up in generating more and more data, trying to fill gaps in the analysis, when what I really should have been doing was writing a Discussion. But the coauthors will do that, giving me a Discussion draft I can work on further. I'm hoping that they'll also come up with answers and suggestions for all (or at least most) of the issues I've raised in the other parts of the manuscript.
Below I'm going to try to summarize the new data (new simulation runs) I've generated. Right now I can't even remember what the runs were for, and I haven't properly analyzed any of them.
A. One pair of runs were two runs with 10 kb genomes that were intended to split the load of a 20 kb genome run that had stalled (needed only as one datapoint on a graph). That run had used a very low mutation rate and I was trying to run it for a million cycles, but it had stalled after 1.87x10^5 cycles. Well, it kept running, but not posting any more data so eventually I aborted it. Splitting it into two 10 kb runds didn't help - both hung after 1.87 x 10^5 cycles. Now I've made two changes. First, I've modified the 'PRINT' commands so that updates to the output file won't be stuck in the cluster's buffer; this may be why updates to the output files were so infrequent (sometimes not for weeks!). Second, I've set these runs to go for only 150,000 cycles and to report the genome sequences when they finish. This will let me use their output sequences as inputs for new runs.
B. Another pair of runs were duplicates of previous runs used to illustrate the equilibrium. One run started with a random-sequence genome and got better, the other started with a genome seeded with many perfect uptake sequences and got worse. They converge on the same final score, as seen in the figure below.

C. And one run was to correct a mistake I'd made in a 5000 cycle run that used the Neisseria meningitidis DUS matrix to specify its uptake bias. I should have set the mutation parameters and the random sequence it started with to have a base composition of 0.51 G+C, but absentmindedly used the H. influenzae value of 0.38. I needed the sequence that this run would produce, because I wanted to use the sequence outputs of it and its H. influenzae USS matrix equivalent as inputs for another 5000 cycles of evolution. I got the sequence from the first run, and started the second pair of runs, but unfortunately the computer cluster I'm using suffered a hiccup and those runs aborted. So I'll queue them again right now. (Pause while I re-queue them...)
D. Then there were four runs that used tiny fragments - enough 50, 25 and 10 bp fragments to cover 50% of the 200 kb genome. Because the length of the recombining fragments sets the minimum spacing of uptake sequences in equilibrium genomes, we expect runs using shorter fragments to give higher scores. But because the fragment mutation rate is 100-fold higher than the genomic rate in our simulations, most of the unselected mutations in our simulated genomes come in by recombination, in the sequences flanking uptake sequences. This means that genomes that recombine 10 bp fragments get few mutations outside of their uptake sequences, so I also ran the 10 bp simulation with a 10-fold higher mutation rate. These runs haven't finished yet - in fact, most of them have hardly begun after 24 hrs. I think I'd better set up new versions that use the bias-reduction feature, and then run the outputs of these in runs with unrelenting bias. (Pause again...)
The rest of the new runs were to fill in an important gap in what we'd done. The last paragraph of the Introduction promised that we would find out what conditions were necessary for molecular drive to cause accumulation of uptake sequences. But we hadn't really done that - i.e. we hadn't made an effort to pin down conditions where uptake sequences don't accumulate. Instead we'd just illustrated all the conditions where they do.
E. So one series of runs tested the effects of using lower recombination cutoffs (used with the additive versions of the matrix) when the matrix was relatively weak. I had data showing that uptake sequences didn't accumulate if the cutoff was less than 0.5, but only for the strong version of the matrix. Now I know that the same is true for the weak version.
F. Another series tested very small amounts of recombination. The lowest recombination I'd tested in the runs I had already done was 0.5% of the genome recombined each cycle, which seemed like a sensible limit as this is only one 100 bp fragment in a 20 kb genome. But this still gave substantial accumulation of uptake sequences, so now I've tested one 100 bp fragment in 50 kb, 100 kb and 200 kb genomes. I was initially surprised that the scores weren't lower, but then remembered that these scores were for the whole genome, and needed to be corrected for the longer lengths. And now I've also remembered that these analyses need to started with seeded sequences as well as random sequences, because this is the rigorous way we're identifying equilibria. (Another pause while I set up these runs and queue them...)
G. The final set of runs looked at what happens when a single large fragment (2, 5 or 10 kb) recombines into a 200 kb genome each cycle. Because there would otherwise be little mutation at positions away from uptake sequences, these runs also had a 10-fold elevated genomic mutation rate. The output genome sequences do have more uptake sequences than the initial random sequences, but the effect is quite small, and the scores for these runs were not significantly different than those for the runs described in the paragraph above, where the fragments were only 100 bp. This is expected (not that I think it through) because the only difference between the runs is that this set's fragments bring in 2-10 kb of random mutations in the DNA flanking the uptake sequence.
(I was going to add some more figures, but...)
Too many figures!

Right now the US variation manuscript has 17 figures*, every one of them close to my heart. And that's not counting the supplementary figures. I'll let my co-authors vote on which ones must go.
* A few of them are just placeholders for data I haven't finished analyzing yet.
But where's the microscope?

This is the optical tweezers setup I'll initially be working with. The microscope slide chamber is clamped to the light-coloured micromanipulator controls at the center, with a water-immersion objective lens on its right side and a light condenser on its left side. The little black and yellow tube at the back left is the infrared laser, and the tall silver strip beside it holds the photodetector that detects the laser light after it is bounced through mirrors and lenses, the slide chamber and condenser, and another mirror. The visible light source is out of view on the left, and the rightmost black thing is the visible-light camera which lets you see what you're doing, via the grey cable that connects it to a computer screen. Lying on the table in front of the camera is a slide chamber, left by one of the biophysics students who've been using this apparatus.
Preparing for optical tweezers work
I spent yesterday morning across town at the physics lab I'll be doing the optical tweezers work in, getting my hands on the equipment I'll be using. One of the many things I learned is that I need to work out the practicalities of bringing together (1) cells that are stuck onto a cover slip and (2) DNA-coated beads. I won't be using a flow-through chamber, at least not initially, but I think I have a plan that will work both for the initial troubleshooting under our own microscope and with the optical tweezers apparatus.

The chamber I'll be using is constructed by sandwiching two strips of Parafilm (thin wax) between a glass microscope slide and a glass coverslip, and then briefly heating the slide to melt the wax so it forms a tight seal along both sides of the coverslip. This creates a chamber that's about 2 cm long by 1 cm wide and about 100 nm high, open at both ends. The chamber holds about 20 µl of liquid. (Hang on, is that volume consistent with those dimensions? 1 cubic cm is 1 ml, and 100 nm is 1/100 of a cm, so yes.) Once the chamber is filled its ends are sealed with melted wax or clear nail polish.
For now let's assume that the cells will stick well to slides coated with poly-L-lysine and remain viable and able to take up DNA provided they're immersed in MIV competence solution or culture medium. And, that we can stick lots of chromosomal DNA onto the 1 micron styrene beads I'll be using. And, that once cells are attached to the coverslip the rest of the coverslip surface can be made non-sticky by a brief soak in a solution of BSA protein, so the DNA-coated beads don't also stick to the coverslip. (I'll no doubt be posting lots more about my efforts to get these steps working.)
Here's my plan. I'll first create a chamber using a coated coverslip (coating down). I'll then introduce some competent cells (in MIV) by pipeting 20 µl onto one edge (say the left edge) of the chamber. Capillary action draws this liquid into the chamber. After a few minutes I'll pipette a larger volume of BSA (in MIV) at the other end of the chamber while placing a tissue at the left edge to draw liquid out. This will create a flow of BSA solution that displaces the cell solution. I'll continue to do this until all the free cells have been washed out of the chamber, and all of the reactive poly-L-lysine has been neutralized by the BSA. Then I'll pipette the beads (in MIV) into the chamber, drawing out the unwanted BSA solution on the other side. And finally I'll dry the edges and seal the ends.
One nice feature is that I should be able to trouble shoot all of this in our own lab with our own microscope. So I can find out what concentration of cells to use, how long to allow for attachment, how much BSA to use, how much washing to get rid of the unattached cells, and how many beads to use. The final test will be whether the DNA-coated beads attach to the cells (at room temperature) but uncoated beads don't. Once I have all this working, it will be time to go back to the optical tweezers apparatus!
Faculty position cover letter Do's and Don't's
Do: Start with the big-picture question your research is investigating.
Do: Explain what distinguishes your work on regulatory protein-of-the-month from everyone else's.
Do: Recheck the final text just before you submit it.

Don't: Say that you're applying because you really want to live here.
Don't: Say that you only found out about the position because your buddy showed you the ad.
Don't: List generic research 'skills' such as gel electrophoresis, cell culture, and Microsoft Excel.
Don't: Say that you're the ideal candidate.
Don't: Say that you will happily apply your specialized techniques to any research question (i.e. you don't care about the science, you just want to play with your toys).
Don't: Give a full history of every project you've ever worked on.
Don't: Fill four pages.
Don't: Talk about your passion for research (or any other feelings).
Don't: Say you're hardworking.
Dont: Delay publishing a first-author paper on your post-doc work until you're about to apply for faculty positions.

Blue screen logouts in Excel - Numbers is not the answer.
Ever since I upgraded to Snow Leopard (a couple of weeks ago), my Mac has been suffering from 'blue screen logouts', especially in Excel. The screen briefly goes blue then I'm back to the desktop with all my open applications closed (and having lost any unsaved work). The solution may be to finally switch from Office 2004 to Office 2008. I think we did buy the Office 2008 suite a couple of years ago, but maybe we only bought a one-computer version that was installed on the laptop of a post-doc who's long gone.
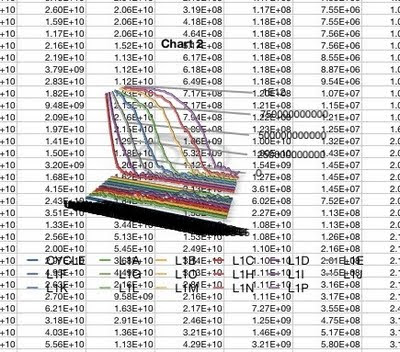
I've got a lot of data to analyze from all the simulations I've run, so I'm going to try using the Mac Numbers app instead. Whoa, doesn't look good. Here's what the default for a line graph produced:
 Weird? Let me count the ways.
Ah, the problems with the previous graph were partly that I had accidentally chosen 3-D. But my new graph is terrible too.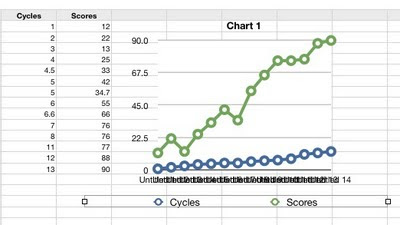
Aha, changing to a scatter plot got it to use my Cycles data for the X-axis values. But now the lines connecting the points have disappeared and I see no way to get them back. And the new legend says that the Xs represent cycles, when they're really Scores. Instead moving the Cycles data over into the grey first column gave a semi-presentable line graph, but now it's not treating the Cycles values as numbers but as textual labels, even though I discovered how to tell it that they are numbers.
I'm afraid Numbers appears to be just a toy app, suitable for children's school projects but not for serious work. I would RTFM but I can't find anything sensible.
I've got a lot of data to analyze from all the simulations I've run, so I'm going to try using the Mac Numbers app instead. Whoa, doesn't look good. Here's what the default for a line graph produced:
 Weird? Let me count the ways.
- The background is transparent.
- This is a 3-D graph.
- The lines are 3-d, like ropes.
- The lines have 3-D shadows.
- There are no visible axes.
- There is no scale.
- There are some numbers connected to some of the lines.
- The legend at the bottom seems to treat the X-axis values as Y-axis values.
Ah, the problems with the previous graph were partly that I had accidentally chosen 3-D. But my new graph is terrible too.

- The symbols are enormous and I can't find any way to change them or remove them.
- My X-axis values are being treated as Y-axis values - I don't know what it's using for the X-axis as the numbers are illegibly jammed together.
- My column headings (Cycles, Scores) are ignored.
Aha, changing to a scatter plot got it to use my Cycles data for the X-axis values. But now the lines connecting the points have disappeared and I see no way to get them back. And the new legend says that the Xs represent cycles, when they're really Scores. Instead moving the Cycles data over into the grey first column gave a semi-presentable line graph, but now it's not treating the Cycles values as numbers but as textual labels, even though I discovered how to tell it that they are numbers.
I'm afraid Numbers appears to be just a toy app, suitable for children's school projects but not for serious work. I would RTFM but I can't find anything sensible.
Uptake sequence stability
I'm back working on the US-variation manuscript. It's looking good. My coauthor's edits are useful, and she had several suggestions for relatively simple new analyses using the simulation of uptake sequence evolution.
She asked whether the positions of uptake sequences were stable once the score had reached equilibrium. Another way to say this is to ask whether the equilibrium is dynamic, with old uptake sequences lost to random mutation and new ones appearing in new places, or whether once an uptake sequence has arisen it tends to persist, presumably because mutant versions are efficiently restored by recombination. In real genomes of the same genus or family we tend to find the latter - uptake sequences are in homologous positions.
So I set up some runs that started with 200kb sequences that had evolved to equilibrium under more-or-less standard simulation conditions and would run for between 5000 and 200,000 additional cycles. The first results are done (just the 5000-cycle runs) and already the results are interesting.
The analysis will need to be redone because I'm not using the correct (10-mer) version of the US-locating perl script, but a 9-mer version intended for perfect USS cores. I'm also doing the analysis inefficiently in Excel using VLOOKUP; maybe my coauthor can write a little perl script to do it.
When the bias of the uptake machinery was fairly weak (because the matrix was applied additively), only one of the 44 perfect 9-mer uptake sequences in the input sequence was in the same location in the output sequence. But when the bias was strong (because the matrix was applied multiplicatively), 145 of the 205 original uptake sequences were present in the same positions in the output sequence.
This is a pleasing result. When the bias is strong, uptake sequences that acquire random mutations are restored by recombination before they can diverge (does this mean within a single cycle?). But when bias is weaker they often diverge before recombination can catch them. I'll have lots more data in a few days - I think some of the runs also test the effect of mutation rate.

New! Improved! The NIH plan!
How's this?
Aim C. Develop a genome-wide map of genes contributing to the transformability differences between these two strains.
Specific Aims:
Aim A. Map the H. influenzae recombinome. This is basically a higher resolution version of what we just proposed to Genome BC. We will propose to use next-gen sequencing to map the frequency of recombination at all the >40,000 SNPs and >300 indels/rearrangements between two H. influenzae strains, Rd and 86-028NP. These frequencies will be the net effects of biases at many levels of the transformation process.
Aim B. Characterize the components contributing to the recombinome of strain Rd.
- Uptake bias (across the outer membrane)
- Translocation biases (across the inner membrane)
- Cytoplasmic biases (nucleases and protection)
- Strand-exchange biases (RecA-dependence)
- Mismatch repair biases
To do this we will use various combinations of mutants and experimental manipulations to (i) eliminate other effects and (ii) generate DNA samples enriched for the effects of the component of interest. For example, we can get a DNA sample enriched for preferred uptake sequences (step 1) by giving rec2-mutant cells synthetic degenerate uptake sequences. We can see the effects of repair (step 5) by comparing the Aim A recombinome with one produced by mismatch-repair mutants. Maybe we can detect RecA's contribution (step 4) by repeating the analysis in rec1 cells expressing the lambda bet recombinase. We can propose lots of different analyses here, giving some high priority, tagging others with 'if time and resources permit', and leaving some as 'future directions'.
I don't seem to have posted about this before, and the post-doc hasn't either (it's his idea). I think it deserves a separate post. I'll just say here that this will be presented partly as a proof-of-concept study for a method that can then be used to map genes contributing to any selectable trait.
Aims B and C both depend on first completing Aim A but they are independent of each other. They also share the lovely property of being open-ended, putting us in the best version of Hershey Heaven.
Now, where was I?
Things to get back to, now the Genome BC grant is done:
Work on the US-variation manuscript: My co-author sent me her comments on the first draft a coupe of weeks ago but I have yet to read them. And I have a lot of new data from simulations that took days and weeks to run. Five more have been running for 3-4 weeks and are still not done - unfortunately I don't have a way to check how close to finishing they are. Each simulation writes very frequent updates to its output file, but but these aren't appearing in the interim copy of the file I can download. I want to get a better draft back to the co-author by the middle of the month.
Optical tweezers work: I'll make my first 'training visit' to the physics lab across town next week, so I need to at least think about what I want to accomplish. Perhaps it's time to get back in the lab and get my hands wet.
NIH proposal: We need to use the momentum from the Genome BC proposal to do serious work on our NIH proposal. It's not due until the start of February, but we need to have a reasonable draft done by Christmas. We should get our first draft done by the end of November (sooner = better).
What else? Our overall short-term plan is to focus on work that will improve the NIH proposal and (if necessary) the CIHR resubmission. The post-doc is going to work on the sample-preparation parts of the NIH work - to show that we can indeed prepare DNAs with the properties we need. The Research Associate is working on CIHR-related problems; my optical tweezers work fits this too. What can I be doing for the NIH proposal, besides writing and getting the US-variation manuscript done?
Genome BC's submission software...
...can't keep its attachments straight.

I upload the budget spreadsheet on the Budget page, but it doesn't appear there. I log out, go back, and it's now on both the Budget page and the Letters of Support page. I upload some letters of support (as pdfs), and they appear in the right place, but the Suggested Referees pdf shows up on the Budget page. Log out, log back in, now the five publication pdfs are on the Publication page, now they've been replaced by the letters of support.
I have my fingers crossed, hoping that the various uploaded pdfs actually are correctly identified in the Genome BC server, and that the screw-up is just in where it tells me they are.
We're just assembling the final big pdf of the components that are submitted as one file (Cover pages and Lay Summary and scientific Summary and Proposal and References and Figures (with the glorious Gantt chart!) and Strategic Objectives and SWOT matrix and... and ...). Then we'll try to upload it onto the appropriate page of the submission program and see what happens next.
Followup: Submission appeared to work fine. But the system doesn't give you a pdf of the total submission that you can check for errors, just a nice green checkmark, so all I can do is hope that all the components are in the right places.
Genome BC proposl angst
(In truth, I'm not even sure what 'angst' means...)
I'm alternating between thinking that our various drafts are written very bacly (so we should just abandon the proposal) and remembering that the science we propose is really dazzling. Back and forth and back and forth...
I'm alternating between thinking that our various drafts are written very bacly (so we should just abandon the proposal) and remembering that the science we propose is really dazzling. Back and forth and back and forth...
The horror!
List of all the components of our Genome BC proposal:
- Signature page
- Participating Organizations Signatures ( ≠ signature page)
- Co-applicants
- Lay summary
- Summary
- Proposal (5 pages, plus 5 for references, figures etc.)
- Gantt chart (to be included with figures)
- SWOT analysis matrix and explanatory statement
- Strategic Outcomes (???)
- Project team
- Budget (Excel spreadsheet provided)
- Co-funding strategy
- Budget justification
- Documents supporting budget justification
- Suporting documents for co-funding
- List of researchers on the 'team' (just me and the post-doc?)
- Researcher profile for me
- Researcher profile for the post-doc
- List of collaborators and support
- Publications (we can attach five relevant pdfs)
- Certification forms form
- Biohazard certification form (we're supposed to get one especially for this proposal, but only if the project is approved)
limits set by sequencing errors
The post-doc and I have also been grappling with how the high error rate of the sequencing technology we'll use affects our ability to detect donor alleles in our big pool of recombinant chromosomes. Because this rate is usually about 0.5-1% per position, at positions where donor and recipient sequences have different bases, about 0.2% of the time sequencing will report a donor allele where the real molecule had a normal recipient allele. If we have 500 reads covering a position, on average one of them will appear to be a donor allele even if there has been much less than 0.2% recombination at that position. Because of random events, some positions with little or no recombination will have no sequences reporting the donor allele, but others will have 2 or 3 or more.
At face value this sets a lower limit to the rates of recombination we'll be able to detect. If a SNP position undergoes 0.1% recombination, the difference in the number of donor alleles reported will not be significantly different from the background due to error. This limit is largely independent of the amount of sequencing we do. In principle one could do enough sequencing to even out the random fluctuations in the numbers of errors seen so that a 0.1% recombination rate at a SNP position would be significantly above background, but 'enough' sequencing would be absurdly expensive.
Luckily for us, another post-doc (the clever partner of mine) has just pointed out that we can use the co-occurrence of donor alleles at adjacent SNP positions in a single sequencing read as evidence of recombination. That's because, once the software has excluded those reads whose sequences appear unreliable, we expect most single-nucleotide errors to occur independently of each other - that is, finding an error at one position does not change the probability of finding an error at another position in the same read. We can of course control for this by looking at our control sequencing of unrecombined genomes and at positions where donor and recipient are identical.
But we expect most recombination tracts to be much longer than the ~75 bp covered by a single read (we're going for these rather than the cheaper 50 bp reads). So if we see donor alleles at two SNP positions in a single read, we can be pretty sure* that they arose by one recombination event, not two coincidental sequencing errors. Of course this logic can only be applied where SNPs are close enough to be sequenced in the same read. The post-doc has now checked this, and tells me that 77% of the SNPs in the two sequences we'll use are within 50 bp of each other (the median separation is only 14 bp).
(*The limit becomes the square of the error rate, about 4 x 10^-6.)
(*The limit becomes the square of the error rate, about 4 x 10^-6.)
It gets better. Because we're going to do 'paired-end' sequencing, we'll actually have two 75 bp sequences for each DNA fragment in our big recombinant pool, separated by about 400 bp of not-sequenced DNA. Provided most recombination tracts are longer than 500 bp (we expect this, and will know for sure from the clones we'll sequence), seeing donor alleles at SNP positions in both end reads will also be evidence of recombination rather than coincidental random errors.
I expect that this analysis will be a pain to do (for the post-doc, as he's the only one with the skills to do it), but it greatly improves our ability to detect low recombination frequencies.
Subscribe to:
Comments (Atom)